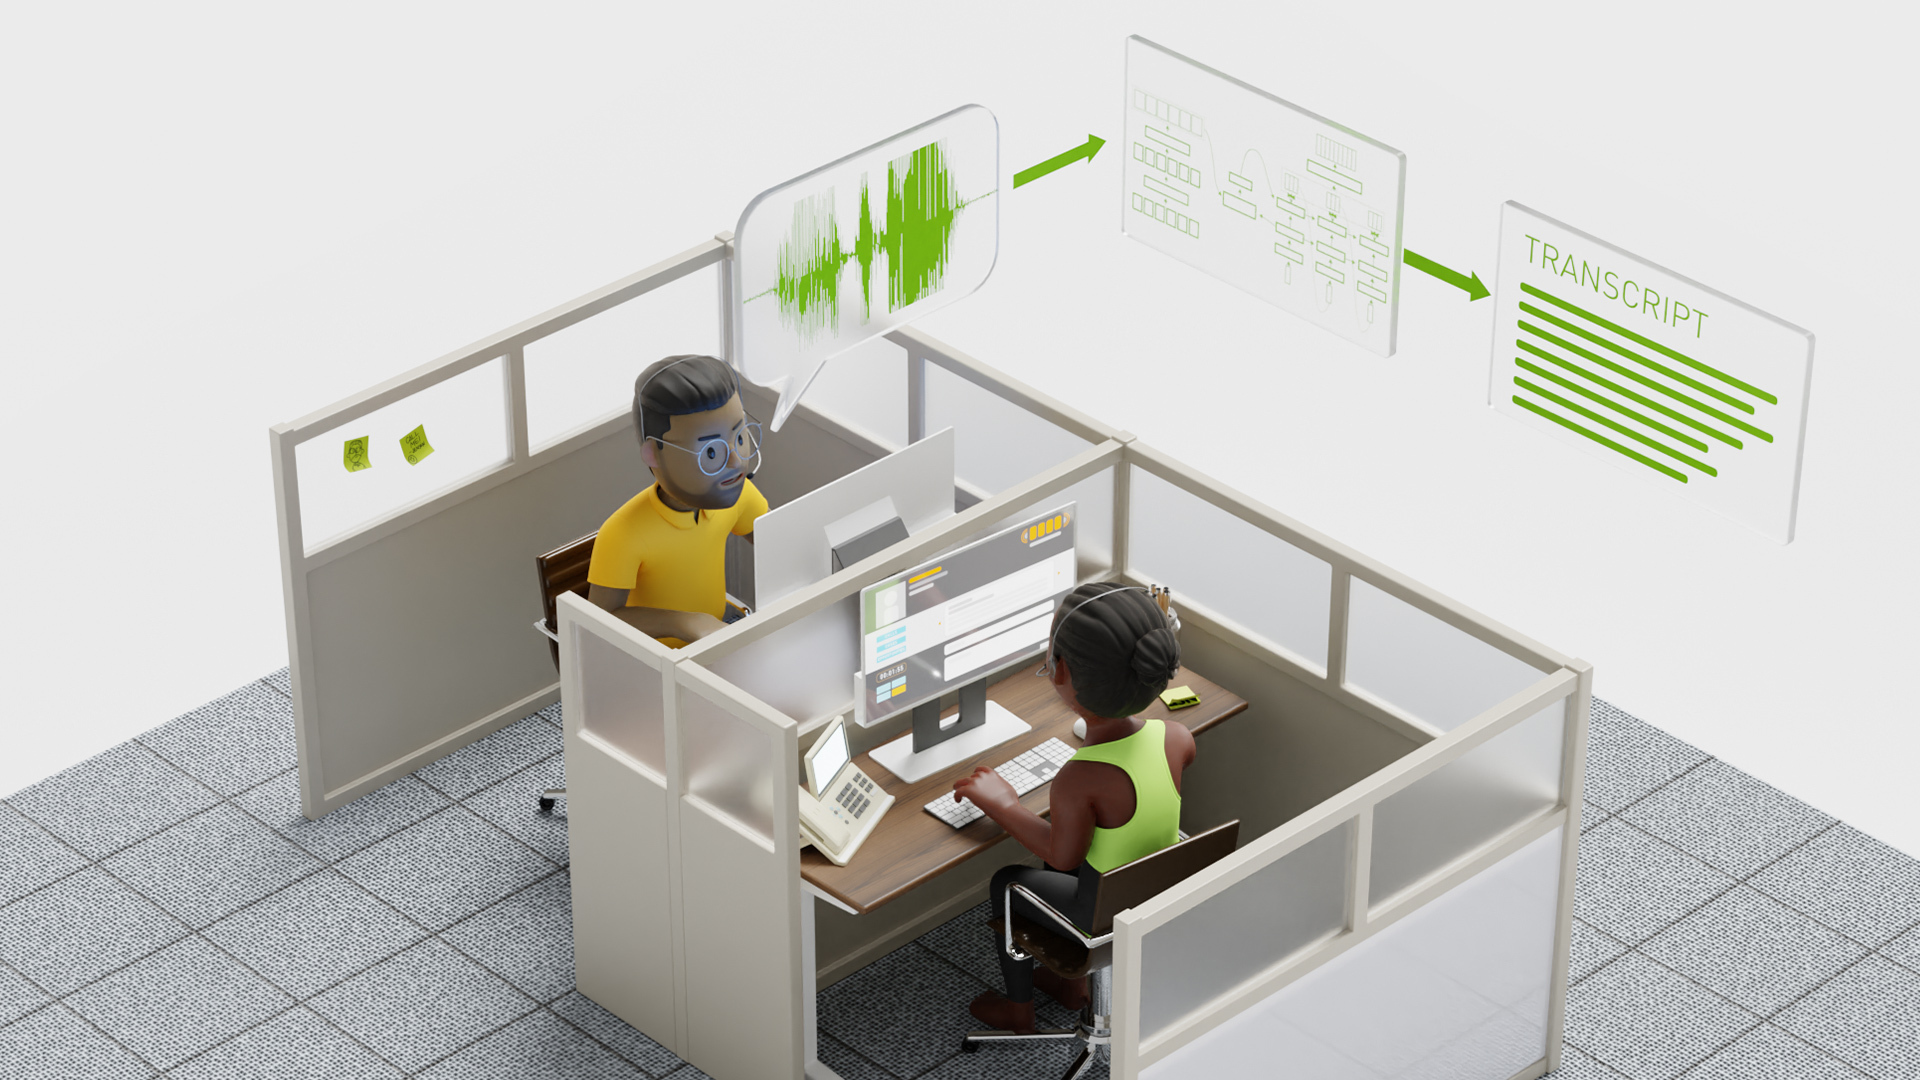
Speech AI applications, from call centers to virtual assistants, rely heavily on automatic speech recognition (ASR) and text-to-speech (TTS). ASR can process the audio signal and transcribe the audio to text. Speech synthesis or TTS can generate high-quality, natural-sounding audio from the text in real time. The challenge of Speech AI is to achieve high accuracy and meet the latency requirements for real-time interaction.
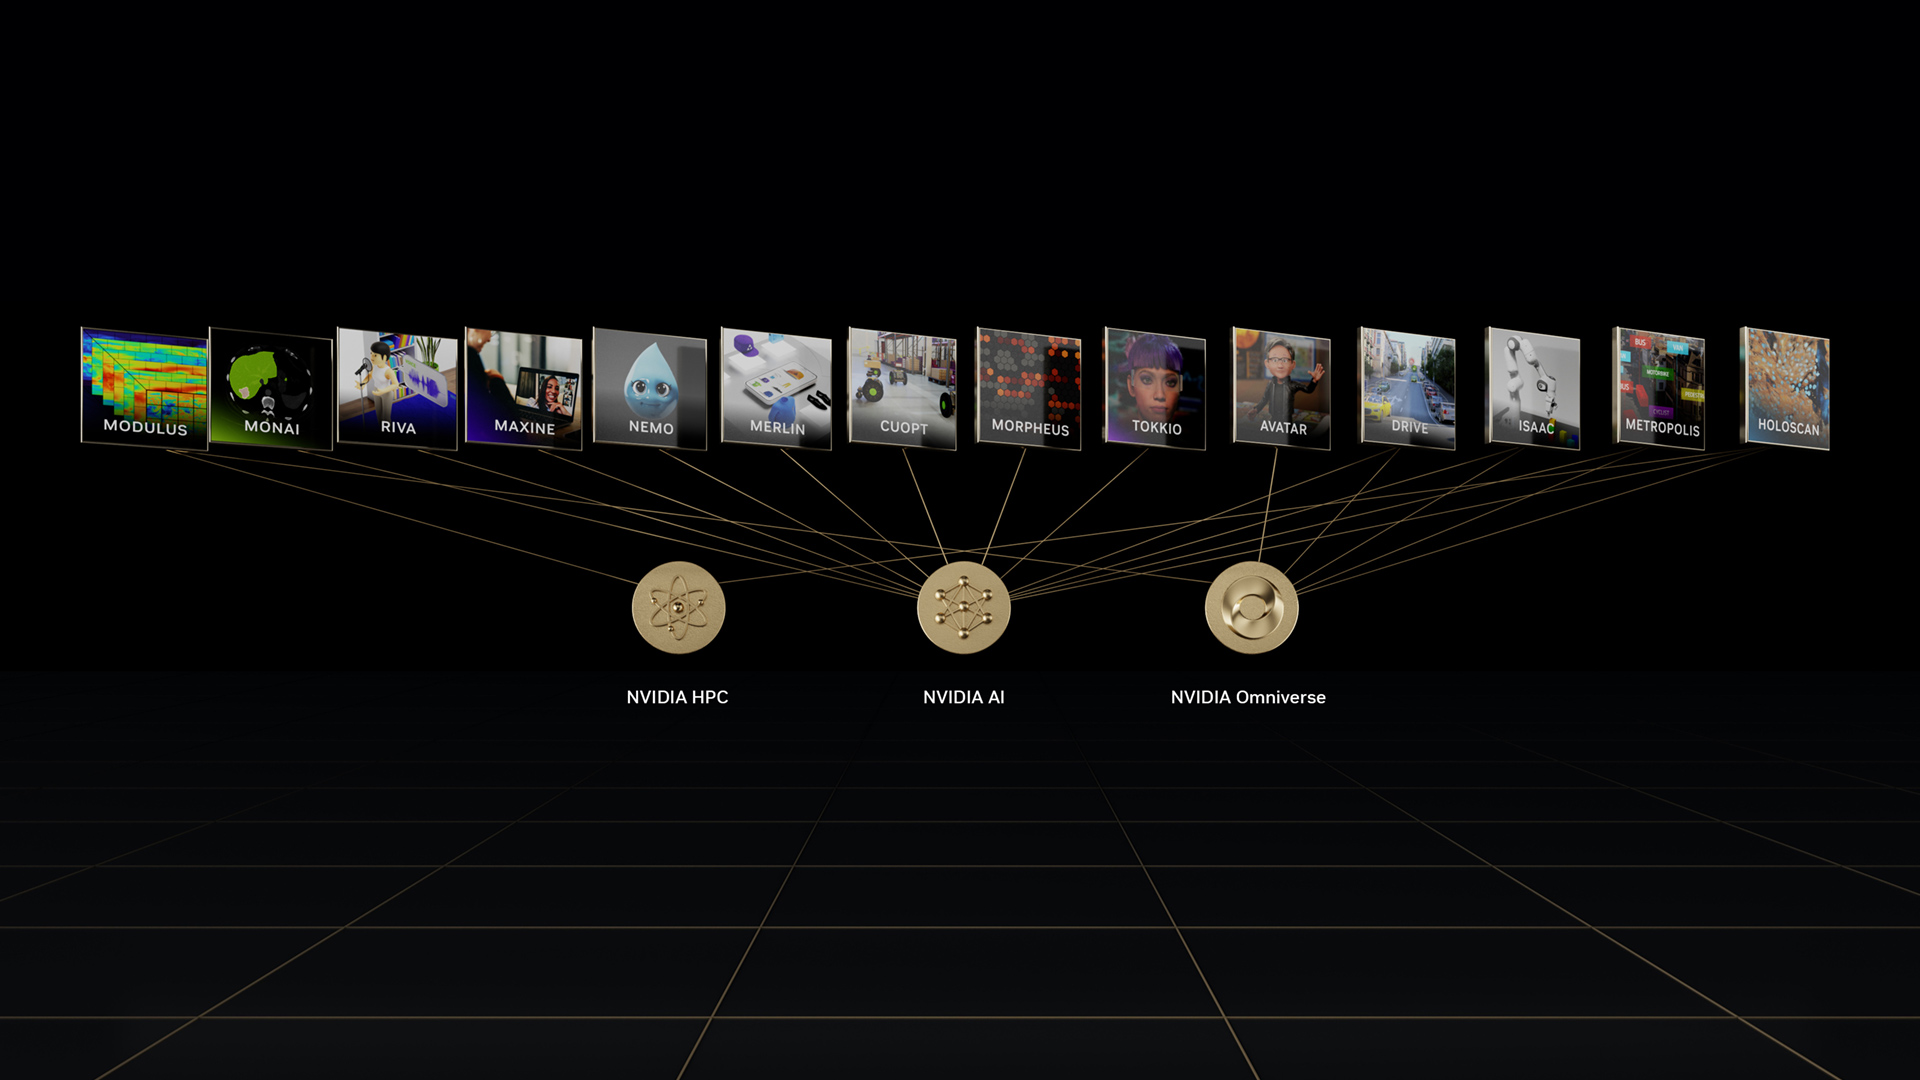
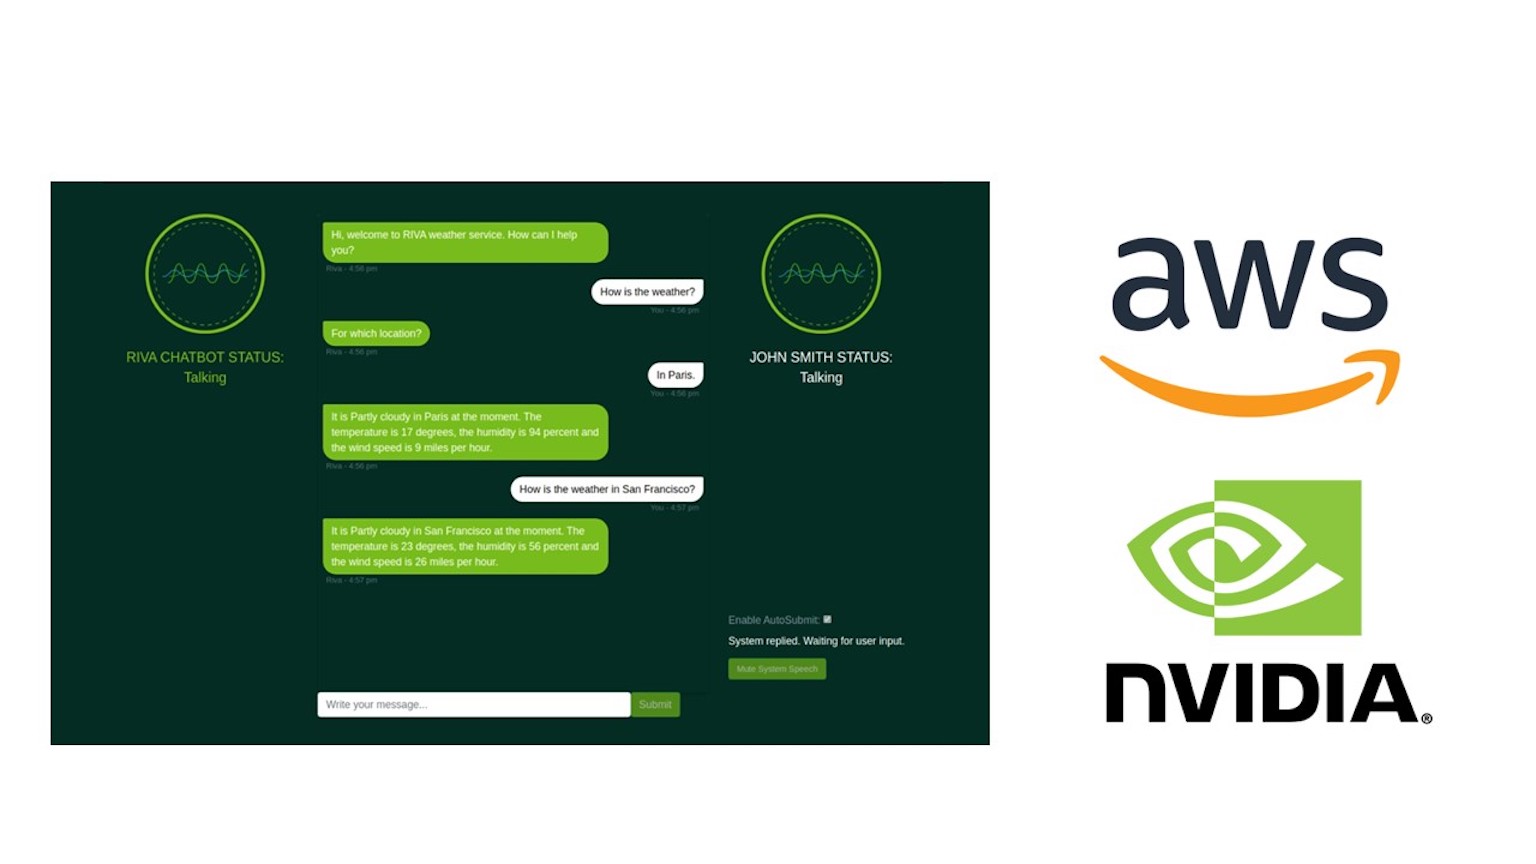
NVIDIA Riva is a GPU-accelerated SDK for building speech AI applications, achieving high accuracy while delivering high throughput using state-of-the-art models. Riva provides world-class speech recognition and text-to-speech skills, to interact with humans across multiple languages. Riva can be deployed on-prem, in the cloud, or on edge or embedded platforms, and you can scale up Riva servers to handle hundreds or thousands of real-time streams with low latency. This post walks you through, step by step, how to deploy Riva servers on a large scale with Kubernetes for autoscaling and Traefik for load balancing.
Riva can be customized for your dataset across different applications, such as chatbots, virtual assistants, and transcription services. The pretrained models can be fine-tuned with the NVIDIA TAO Toolkit using transfer learning, making your development much faster than pretraining your models from scratch. The pretrained models for speech recognition and speech synthesis are provided in the NVIDIA GPU Cloud.
The non-English (Spanish, German, and Russian) ASR models are trained on a variety of open-source datasets, such as Mozilla Common Voice, as well as private datasets. Riva automatic speech recognition models are developed to provide out-of-the-box accuracy and serve as a great starting point for adapting to industry, jargon, dialect, or even noisy surroundings.

For users to enjoy lifelike dialogue, speech applications must offer human-like expressions. Using the FastPitch model, Riva helps developers customize the text-to-speech pipeline and create expressive human-like voices. For example, during inference time, developers can vary voice pitch and speed using SSML tags. The latest state-of-the-art models such as Fastpitch in Riva help text-to-speech pipelines run several times faster than other competing options in the market.?
Hardware and software prerequisites
To scale your Riva deployment to handle hundreds to thousands of real-time streams with low latency, you can make use of Kubernetes. Preparing a Kubernetes cluster for Riva deployment involves meeting several prerequisites.
First, ensure that your Kubernetes nodes have GPUs available. Running Riva’s deep neural networks on the GPU is critical for ensuring the low latency and high bandwidth requirements for real-time streaming. Riva is supported on NVIDIA Volta or later GPUs, and it is recommended that each GPU have a minimum of 16 GB of VRAM. Riva can also be deployed on public cloud compute instances with the appropriate GPU resources, such as AWS EC2 instances.
Next, enable access to the GPUs from workloads running in your Kubernetes cluster. The easiest way to do this is to use the NVIDIA GPU Operator, which will automatically set up and manage the NVIDIA software components on the worker nodes.
If you prefer, you can also install and manage the GPU software components yourself. In this case, you need an NVIDIA GPU Driver and the NVIDIA Container Toolkit on each of your nodes, as well as the NVIDIA device plugin for Kubernetes. This enables Kubernetes to discover which nodes have GPUs and make them available to containers running on those nodes. You can also optionally install the GPU Feature Discovery plugin, which will generate labels for each node describing the GPU features available.
The publicly available version of NVIDIA GPU Operator is free of charge and includes community support only. NVIDIA AI Enterprise is recommended for enterprise customers. With an active subscription, you can use a fully validated and enterprise-supported version of GPU Operator. For more information, see the NVIDIA AI Enterprise documentation.
To support autoscaling, Prometheus must be installed in your Kubernetes cluster to collect metrics and report them to your control plane. Also ensure that the Kubernetes API Aggregation Layer is enabled in your Kubernetes cluster, which allows the autoscaler to access external APIs like Prometheus.
To use the Helm chart in the next section, install Helm using the following script:
$ curl -fsSL -o get_helm.sh https://raw.githubusercontent.com/helm/helm/main/scripts/get-helm-3
$ chmod 700 get_helm.sh
$ ./get_helm.sh
Then use the kube-prometheus-stack Helm chart to install the Prometheus monitoring stack:
$ helm repo add prometheus-community https://prometheus-community.github.io/helm-charts
$ helm repo update
$ helm install <name> --set prometheus.prometheusSpec.serviceMonitorSelectorNilUsesHelmValues=false
prometheus-community/kube-prometheus-stack
Autoscale Riva deployment
The four main steps to deploying Riva for speech AI inference with autoscaling and load balancing are:
- Create Kubernetes deployment for Riva servers
- Create Kubernetes service to expose Riva servers as a network service
- Autoscale Riva deployment:
- Expose NVIDIA Triton metrics to Prometheus using kube-prometheus and ServiceMonitor
- Deploy Prometheus Adapter for the custom metric
- Create the Horizontal Pod Autoscaler (HPA)
- Use Traefik to distribute client requests among all the Pods
Helm chart for Riva deployment
You can use a Helm chart for this deployment, as it is easy to modify and deploy across different environments. A chart is organized as a collection of files inside the riva directory, as shown below. Inside the riva directory, Helm will expect a structure that matches the files below:
chart.yaml: This is where you put all the information about the chart you are packaging. So, for example, your version number and the dependencies.
values.yaml: This is where you define all the values you want to inject into your templates directory.
charts: This is the directory where you store other charts that the Riva chart depends on. The Riva depends on the Traefik and Prometheus adapter charts for ingress and autoscaling respectively.
templates: This is the directory where you put the actual manifest you are deploying with the chart.
For the Riva server, you need deployment.yaml, service.yaml, hpa.yaml, and ingressroute.yaml all in the templates directory. These will all get certain configuration values from values.yaml. Conventionally, Helm charts also include helper templates inside of a partials file, usually called _helpers.tpl.
You can change the configurations for your deployment by modifying values.yaml for the fields in the files: templates/*.yaml.
riva/
     chart.yaml
     values.yaml
     charts/
     templates/
            deployment.yaml
            service.yaml
            hpa.yaml
            ingressroute.yaml
            _helpers.tpl
The chart.yaml file below needs to specify all the information about the chart, such as the Riva version and the repositories of Traefik Helm Chart and Prometheus Community Kubernetes Helm Charts.
apiVersion: v1
appVersion: 1.9.0-beta
description: Riva Speech Services
name: riva
version: 1.9.0-beta

dependencies:
    - name: traefik
      version: "~10.6.2"
      repository: "https://helm.traefik.io/traefik"
      tags:
         - loadBalancing
    - name: prometheus-adapter
      version: "~3.0.0"
      repository: "https://prometheus-community.github.io/helm-charts"
      tags:
         - autoscaling
Create Kubernetes deployment for Riva servers
A Kubernetes deployment provides declarative updates for Pods and ReplicaSets. The deployment.yaml below creates a set of replicated Kubernetes Pods for Riva servers. You can specify how many Kubernetes Pods you want to start your deployment with, indicated by the .spec.replicas field. The .spec.containers field tells each Kubernetes Pod to have a Riva server docker container running on a GPU device.
The .spec.selector field defines how the deployment finds which Pods to manage. Port number 50001 is specified for Riva servers to receive inference requests from clients by GRPC, while port 8002 is for NVIDIA Triton metrics. The fields in deployment.yaml can be modified in values.yaml based on your deployment.
kind: Deployment
metadata:
  […]
spec:
  replicas: {{ .Values.autoscaling.minReplicas }}
  selector:
  […]
  template:
    metadata:
      labels:
        app: {{ template "riva-server.name" . }}

spec:
      volumes:
      […]
      containers:
        - name: riva-speech-api
          image: {{ $server_image }}
         imagePullPolicy: {{ .Values.riva.pullPolicy }}
         resources:
            limits:
              nvidia.com/gpu: {{ .Values.riva.numGpus }}
command: ["/opt/riva/bin/start-riva"]
args:
   {{- range $service, $enabled := .Values.riva.speechServices }}
    - "--{{$service}}_service={{$enabled}}"
   {{- end }}

env:
    - name: TRTIS_MODEL_STORE
      value: "/data/models“

ports:
    - containerPort: 50051
      name: speech-grpc
    - containerPort: 8000
      name: http-triton
    - containerPort: 8001
      name: grpc-triton
     - containerPort: 8002
       name: metrics-triton

volumeMounts:
    - mountPath: /data/
      name: workdir
……
Create Kubernetes service for Riva servers
A Kubernetes service is an abstract way to expose an application running on a set of Pods as a network service. The service.yaml provided below exposes Riva servers as a network service, so Riva servers are ready to receive inference requests from the clients. Since NVIDIA Triton Inference Server is an intrinsic component of Riva servers, NVIDIA Triton metrics can be collected from Port number 8002 in the same way as if you are using NVIDIA Triton Inference Server. The fields in service.yaml can be modified in values.yaml based on your deployment.
When creating a service, you have the option of automatically creating an external load balancer by setting clusterIP: None. (If you want to specify a given IP address, see the Kubernetes service documentation.) This enables Kubernetes to automatically assign an externally accessible IP address that sends traffic to the correct port on your Kubernetes cluster nodes.
apiVersion: v1
kind: Service
metadata:
  name: {{ template "riva-server.fullname" . }}
  labels:
    app: {{ template "riva-server.name" . }}
spec:
  selector:
     app: {{ template "riva-server.name" . }}

  clusterIP: None

   ports:
    - port: 50051
      targetPort: speech-grpc
      name: riva-speech
    - port: 8000
      targetPort: http
      name: triton-http
    - port: 8001
      targetPort: grpc
      name: triton-grpc
    - port: 8002
      targetPort: metrics
      name: metrics
Autoscale Riva deployment
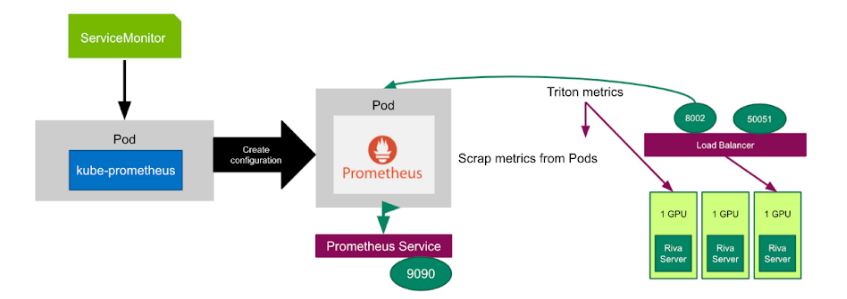
In order to automatically change the number of Riva servers on Kubernetes Pods, you need a ServiceMonitor to monitor Riva Service for target discovery by Prometheus. You also need kube-Prometheus to deploy Prometheus and link Prometheus to metric endpoints. In the yaml file below, ServiceMonitor is set to monitor Riva Service every 15 seconds.
apiVersion: monitoring.coreos.com/v1
kind: ServiceMonitor
metadata:
     name: {{ template "riva-server-metrics-monitor.fullname" . }}
     namespace: {{ .Release.Namespace }}
     labels:
        app: {{ template "riva-server-metrics-monitor.name" . }}
        chart: {{ template "riva-server.chart" . }}
        release: {{ .Release.Name }}
spec:
    selector:
        matchLabels:
             app: {{ template "riva-server.name" . }}
    endpoints:
    - port: metrics
      interval: 15s
You can use Prometheus to scrape the NVIDIA Triton metrics from all the Kubernetes Pods at Port number 8002, then define a new custom metric based on NVIDIA Triton metrics using PromQL (Prometheus Query language), to tell Prometheus adapter how to collect this custom metric as below:
prometheus-adapter:
prometheus:
url: http://example-metrics-kube-prome-prometheus.default.svc.cluster.local
port: 9090
rules:
custom:
- seriesQuery: 'nv_inference_queue_duration_us{namespace="default",pod!=""}'
resources:
overrides:
namespace:
resource: "namespace"
pod:
resource: "pod"
name:
matches: "nv_inference_queue_duration_us"
as: "avg_time_queue_ms"
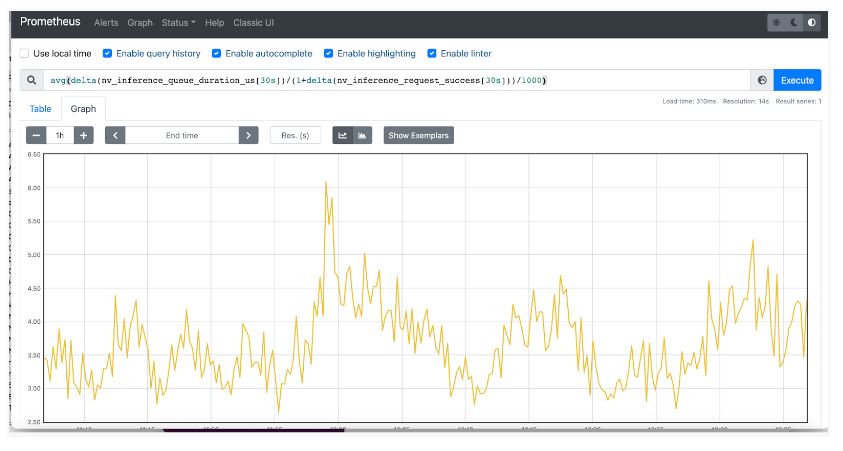
metricsQuery: 'avg(delta(nv_inference_queue_duration_us{<<.LabelMatchers>>}[30s])/(1+delta(nv_inference_request_success{<<.LabelMatchers>>}[30s]))/1000) by (<<.GroupBy>>)’
You can use two NVIDIA Triton metrics to define the custom metric avg_time_queue_ms which means the average queue time per inference request in the past 30 seconds and HPA decides whether to change the replica number based on it.
nv_inference_request_success[30]is the number of successful inference requests in the past 30 seconds.nv_inference_queue_duration_usis the cumulative inference queuing duration in microseconds.
Now that you have a running copy of Prometheus that is monitoring your application, you need to deploy the Prometheus adapter, which knows how to communicate with both Kubernetes and Prometheus, acting as a translator between the two. If you include the prometheus-adapter section in chart.yaml, the Prometheus adapter will be deployed automatically.
The Prometheus adapter helps you to leverage the metrics collected by Prometheus and use them to make scaling decisions. These metrics are exposed by an API service and can be readily used by HPA. HPA can use the custom metric to automatically scale (up and down) the replica number of Kubernetes Pods based on the volume of the inference requests. If the value of the custom metric is higher than the desired value, HPA can increase the number of replicas to reduce the queue time.
In hpa.yaml and value.yaml, you need to specify the maximum and minimum numbers of replicas for deployment. In value.yaml, you can use pods for metrics.type to take the average of the given metrics across all the Pods controlled by the autoscaling target. The target or desired metric value can be set at any number based on your requirement for the response time.
The selection of a relevant metric used by the HPA depends on the service level requirement in your organization, for example, you might also want to sacrifice response time in favor of overall device utilization, to minimize the cost of application deployment. In this example, the response time to inference requests is selected as the primary metric for the HPA.
hpa.yaml
apiVersion: autoscaling/v2
kind: HorizontalPodAutoscaler
metadata:
     name: riva-hpa
     namespace: {{ .Release.Namespace }}
     labels:
        app: {{ template "riva-server.name" . }}
        chart: {{ template "riva-server.chart" . }}
        ……
spec:
    scaleTargetRef:
        apiVersion: apps/v1
        kind: Deployment
        name: {{ template "riva-server.fullname" . }}
    minReplicas: {{ .Values.autoscaling.minReplicas }}
    maxReplicas: {{ .Values.autoscaling.maxReplicas }}
    metrics: {{ toYaml .Values.autoscaling.metrics | nindent 2}}


values.yaml
autoscaling:
    minReplicas: 1
    maxReplicas: 3
    metrics:
         - type: Pods
           pods:
               metric:
                    name: avg_time_queue_ms
               target:
                   type: AverageValue
                   averageValue: 500m
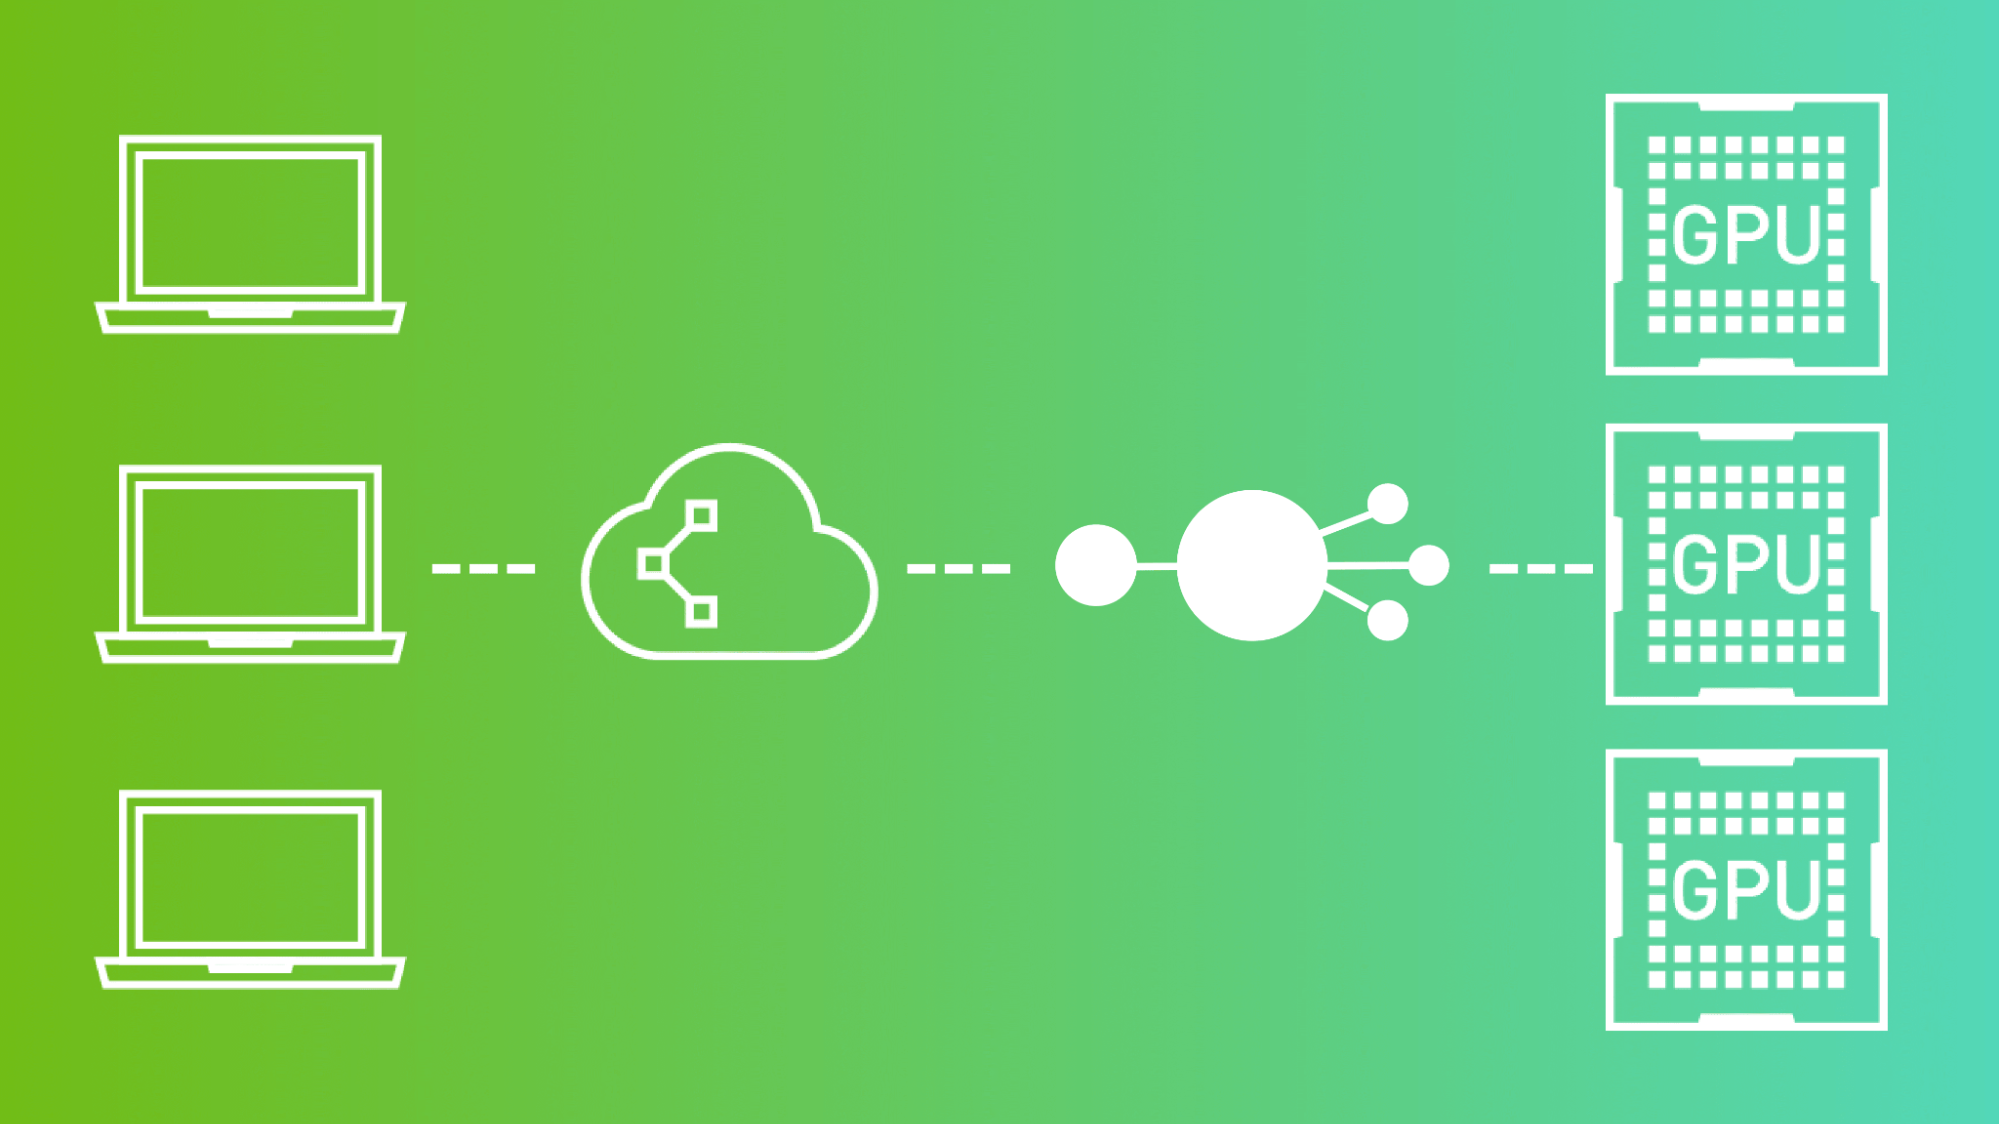
Load balance of Riva deployment with Traefik
You also need a load balancer to help spread the inference requests among all the Riva servers evenly, based on the load pressure. Generally speaking, there are two types of load balancers: Layer 4 and Layer 7. Layer4 load balancers reside on the Transport layer of the network and are agnostic of the actual service (such as HTTP in the case of gRPC). Layer7 load balancers reside on the Application layer and usually proxy the requests for a specific service to the endpoints.
This example uses the Traefik ingress controller and load balancer, which is Layer 7, to receive the inference requests and then distribute them across all the Riva servers. Register the IngressRoute kind in the Kubernetes cluster and use h2c protocol for GRPC in Traefik, as shown in ingressroute.yaml below.
apiVersion: traefik.containo.us/v1alpha1
kind: IngressRoute
metadata:
     name: {{ template "riva-server-ingressroute.name" . }}
     namespace: {{ .Release.Namespace }}
     labels:
        app: {{ template "riva-server.name" . }}
        chart: {{ template "riva-server.chart" . }}
        release: {{ .Release.Name }}
        heritage: {{ .Release.Service }}
spec:
    entryPoints:
         - riva-grpc
    routes:
        - match: PathPrefix(`/`)
          kind: Rule
          services:
              - name: {{ template "riva-server.fullname" . }}
                port: 50051
                scheme: h2c
Try Riva deployment
Finally, you can put everything together, enabling Riva clients to send inference requests to Riva servers. For Riva servers, everything can be installed using a Helm chart:
$ helm install <name>  .
$ kubectl get svc
NAME                  TYPE           CLUSTER-IP      EXTERNAL-IP       PORT(S)                              AGE
riva-traefik    LoadBalancer      X.X.X.X             <pending>     50051:32067/TCP,80:30082/TCP   69s
You can test Riva client by running Riva streaming ASR Client, provided in the NGC Riva Client image. Ask Riva client to send streaming inference requests to Riva servers, enabling HPA to autoscale (up or down) the number of Kubernetes Pods.
$ riva_streaming_asr_client --riva_uri=<IP address of load balancer>:50051 --audio_file /work/wav/en-US_sample.wav --num_parallel_requests=32 --num_iterations=1024You can also query NVIDIA Triton metrics from Prometheus and visualize the results in time series by navigating to its metrics endpoint: localhost:9090/metrics.
Conclusion
This post provides the step-by-step instructions and code to autoscale NVIDIA Riva deployment in a Kubernetes environment. It also shows you how to balance the workload using Traefik. View all the steps and results.
To learn more, watch the Autoscaling Riva Deployment with Kubernetes for Conversational AI in Production GTC 2022 session. For more information about deploying AI inference workloads on a large scale with Kubernetes and NGINX Plus (as another load balancer option), see Deploying NVIDIA Triton at Scale with MIG and Kubernetes.