As of 3/18/25, NVIDIA Triton Inference Server is now NVIDIA Dynamo.
NVIDIA NIM microservices are model inference containers that can be deployed on Kubernetes. In a production environment, it’s important to understand the compute and memory profile of these microservices to set up a successful autoscaling plan.
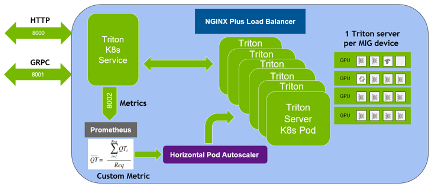
In this post, we describe how to set up and use Kubernetes Horizontal Pod Autoscaling (HPA) with an NVIDIA NIM for LLMs model to automatically scale up and down microservices based on specific custom metrics.
Prerequisites
To follow along with this tutorial, you need the following list of prerequisites:
- An NVIDIA AI Enterprise license
- NVIDIA NIM for LLMs is available for self-hosting under the NVIDIA AI Enterprise License. Deploying NIM for LLMs in your cluster requires generating an NGC API KEY so the Kubernetes cluster can download the container image.
- A Kubernetes cluster version 1.29 or later (we used DGX Cloud Clusters)
- Admin access to the Kubernetes cluster
- Kubernetes CLI tool kubectl installed
- HELM CLI installed
Setting up a Kubernetes cluster
The first step in this tutorial is to set up your Kubernetes cluster with the appropriate components to enable metric scrapping and availability to the Kubernetes HPA service. This requires the following components:
- Kubernetes Metrics Server
- Prometheus
- Prometheus Adapter
- Grafana
Kubernetes Metrics Server
Metrics Server is responsible for scraping resource metrics from Kubelets and exposes them in Kubernetes API Server through the Metrics API. This is used by both the Horizontal Pod Autoscaler and the kubectl top command.
To install the Kubernetes Metric Server, use Helm.
helm repo add metrics-server https://kubernetes-sigs.github.io/metrics-server/helm upgrade --install metrics-server metrics-server/metrics-server |
Prometheus and Grafana
Prometheus and Grafana are well known tools for scraping metrics from pods and creating dashboards. To install Prometheus and Grafana, use the kube-prometheus-stack Helm chart that includes many different components.
helm repo add prometheus-community https://prometheus-community.github.io/helm-chartshelm repo updatehelm install [RELEASE_NAME] prometheus-community/kube-prometheus-stack |
The Prometheus adapter exposes the scraped metrics from Prometheus in the Kubernetes apiserver through Metrics API. This enables HPA to use custom metrics from pods to make scaling strategies.
To install the Prometheus adapter in the same namespace as Prometheus and Grafana, use the following Helm commands:
helm repo add prometheus-community https://prometheus-community.github.io/helm-chartshelm repo updatehelm install <name> prometheus-community/prometheus-adapter -n <namespace> |
Make sure that the Prometheus adaptor is pointing to the correct Prometheus service endpoint. In this case, I had to edit the deployment and correct the URL.
kubectl edit deployment prom-adapter-prometheus-adapter -n prometheusspec: affinity: {} containers: - args: - /adapter - --secure-port=6443 - --cert-dir=/tmp/cert - --prometheus-url=http://prometheus-prometheus.prometheus.svc:9090 - --metrics-relist-interval=1m - --v=4 - --config=/etc/adapter/config.yaml image: registry.k8s.io/prometheus-adapter/prometheus-adapter:v0.12.0 |
If everything is set up right, you should see metrics from Prometheus using the following command:
kubectl get --raw "/apis/custom.metrics.k8s.io/v1beta1/namespaces/<namespace>/pods/*/gpu_cache_usage_perc?selector=app%3Dmeta-llama3-8b"{"kind":"MetricValueList","apiVersion":"custom.metrics.k8s.io/v1beta1","metadata":{},"items":[{"describedObject":{"kind":"Pod","namespace":"<namespace>","name":"meta-llama3-70b-5db5f7dd89-tvcwl","apiVersion":"/v1"},"metricName":"gpu_cache_usage_perc","timestamp":"2025-01-02T20:13:15Z","value":"1m","selector":null},{"describedObject":{"kind":"Pod","namespace":"<namespace>","name":"meta-llama3-8b-5c6ddbbfb5-dp2mv","apiVersion":"/v1"},"metricName":"gpu_cache_usage_perc","timestamp":"2025-01-02T20:13:15Z","value":"14m","selector":null}]} |
Deploying a NIM microservice
In this tutorial, you use NIM for LLMs as a microservice to scale, specifically using model meta/llama-3.1-8b-instruct. There are multiple options for deploying a NIM microservice:
- Using Helm
- Using the NIM Operator
After deployment, you should note the service name and namespace of your NIM for LLMs microservice, as this will be used in many commands.
NIM for LLMs already exposes a Prometheus endpoint with many interesting metrics. To see the endpoint, use the following commands:
kubectl -n <namespace> port-forward svc/<service-name> 8080 |
From a browser, go to localhost:8080/metrics and look for the specific metric named gpu_cache_usage_perc. In this post, you use this metric as a basis for autoscaling. This metric shows the percent utilization of the KV cache and is reported by the vLLM stack.
You will use the NIM for LLMs Grafana dashboard to observe these metrics. Download the JSON dashboard and upload it to your Grafana instance. To log in to the dashboard, see the Grafana access instructions.
After loading the NIM for LLMs dashboard, you should see a similar dashboard as Figure 1. (I had both 70b and 8b deployed for that dashboard, hence the double KV cache numbers.)

Now that you have your observability stack and microservice deployed, you can start generating traffic and observing metrics in the Grafana dashboard. The tool to use for generating traffic is genai-perf.
To run this tool from a pod on your cluster, follow these steps and make sure to install in the same namespace as your NIM for LLMs microservice.
Create a pod with NVIDIA Triton:
kubectl run <pod-name> --image=nvcr.io/nvidia/tritonserver:24.10-py3-sdk -n <namespace> --command -- sleep 100000? |
Log into the pod and now you can run the genai-perf CLI:
kubectl exec --stdin --tty <pod-name> -- /bin/bashgenai-perf --help |
To send traffic to model meta/llama-3.1-8b-instruct requires genai-perf to download the appropriate tokenizer from Hugging Face. Get the API key from Hugging Face and log in.
pip install --upgrade huggingface_hub[cli]export HF_TOKEN=<hf-token>huggingface-cli login --token $HF_TOKEN |
Set up the correct environment variables and generate traffic. For more information about the different parameters, see the genai-perf documentation. The model name and service name must be accurate and reflect your setup.
export INPUT_SEQUENCE_LENGTH=200export INPUT_SEQUENCE_STD=10export OUTPUT_SEQUENCE_LENGTH=200export CONCURRENCY=10export MODEL=meta/llama-3.1-8b-instructgenai-perf profile \ -m $MODEL \ --endpoint-type chat \ --service-kind openai \ --streaming -u meta-llama3-8b:8080 \ --synthetic-input-tokens-mean $INPUT_SEQUENCE_LENGTH \ --synthetic-input-tokens-stddev $INPUT_SEQUENCE_STD \ --concurrency $CONCURRENCY \ --output-tokens-mean $OUTPUT_SEQUENCE_LENGTH \ --extra-inputs max_tokens:$OUTPUT_SEQUENCE_LENGTH \ --extra-inputs min_tokens:$OUTPUT_SEQUENCE_LENGTH \ --extra-inputs ignore_eos:true \ --tokenizer meta-llama/Meta-Llama-3-8B-Instruct -- -v --max-threads=256 |
For this post, I created multiple traffic generation runs by varying the concurrency number: 100, 200, 300, and 400. From the Grafana dashboard, you can see the KV cache utilization percentage (Figure 2). The KV cache percent utilization is increasing with each concurrency trial, from 9.40% at 100 concurrency all the way to 40.9% at 400 concurrency. You can also change other relevant parameters, such as input and output sequence length, and observe the impact on KV cache utilization.

Now that you’ve observed the impact of concurrency on KV cache utilization, you can create the HPA resource. Create the HPA resource to scale based on the gpu_cache_usage_perc metric:
apiVersion: autoscaling/v2kind: HorizontalPodAutoscalermetadata: name: gpu-hpa-cachespec: scaleTargetRef: apiVersion: apps/v1 kind: Deployment name: meta-llama3-8b minReplicas: 1 maxReplicas: 10 metrics: - type: Pods pods: metric: name: gpu_cache_usage_perc target: type: AverageValue averageValue: 100mkubectl create -f hpa-gpu-cache.yaml -n <namespace> kubectl get hpa -n <namepsace> -w |
NAME REFERENCE TARGETS MINPODS MAXPODS REPLICAS AGEgpu-hpa-cache Deployment/meta-llama3-8b 9m/100m 1 10 1 3m37s |
Run genai-perf at different concurrencies (10, 100, 200) and watch the HPA metric increase:
kubectl get hpa -n <namepsace> -w |
NAME REFERENCE TARGETS MINPODS MAXPODS REPLICAS AGEgpu-hpa-cache Deployment/meta-llama3-8b 9m/100m 1 10 1 3m37sgpu-hpa-cache Deployment/meta-llama3-8b 8m/100m 1 10 1 4m16sgpu-hpa-cache Deployment/meta-llama3-8b 1m/100m 1 10 1 4m46sgpu-hpa-cache Deployment/meta-llama3-8b 33m/100m 1 10 1 5m16sgpu-hpa-cache Deployment/meta-llama3-8b 56m/100m 1 10 1 5m46sgpu-hpa-cache Deployment/meta-llama3-8b 39m/100m 1 10 1 6m16sgpu-hpa-cache Deployment/meta-llama3-8b 208m/100m 1 10 1 6m46sgpu-hpa-cache Deployment/meta-llama3-8b 208m/100m 1 10 3 7m1sgpu-hpa-cache Deployment/meta-llama3-8b 293m/100m 1 10 3 7m16sgpu-hpa-cache Deployment/meta-llama3-8b 7m/100m 1 10 3 7m46s |
Check the number of pods and you should see that autoscaling added two new pods:
kubectl get pods -n <namespace> |
NAME ? ? ? ? ? ? ? ? ? ? ? ? ? ? ? ? ? ? ? READY ? STATUS? ? ? ? ? ? ? RESTARTS? ? ? AGEmeta-llama3-8b-5c6ddbbfb5-85p6c? ? ? ? ? ? 1/1 ? ? Running ? ? ? ? ? ? 0 ? ? ? ? ? ? 25smeta-llama3-8b-5c6ddbbfb5-dp2mv? ? ? ? ? ? 1/1 ? ? Running ? ? ? ? ? ? 0 ? ? ? ? ? ? 146mmeta-llama3-8b-5c6ddbbfb5-sf85v? ? ? ? ? ? 1/1 ? ? Running ? ? ? ? ? ? 0 ? ? ? ? ? ? 26s |
HPA also scales down. The time period to wait before scaling down is dictated by the --horizontal-pod-autoscaler-downscale-stabilization flag, which defaults to 5 minutes. This means that scale downs occur gradually, smoothing out the impact of rapidly fluctuating metric values. Wait 5 minutes and check the scale down.
kubectl get pods -n <namespace> |
NAME ? ? ? ? ? ? ? ? ? ? ? ? ? ? ? ? ? ? ? READY ? STATUS? ? ? ? ? ? ? RESTARTS? ? ? AGEmeta-llama3-8b-5c6ddbbfb5-dp2mv? ? ? ? ? ? 1/1 ? ? Running ? ? ? ? ? ? 0 ? ? ? ? ? ? 154m |
Conclusion
In this post, I described how to set up your Kubernetes cluster to scale on custom metrics and showed how you can scale a NIM for LLMs based on the KV cache utilization parameter.
There are many advanced areas to explore further in this topic. For example, many other metrics could also be considered for scaling, such as request latency, request throughput, and GPU compute utilization. You can scale on multiple metrics in one HPA resource and scale accordingly.
Another area of interest is the ability to create new metrics using Prometheus Query Language (PromQL) and add them to the configmap of the Prometheus adapter so that HPA can scale.