Starting in Nsight Graphics 2023.1, the GPU Trace Profiler is the best way to profile your graphics application at the frame level. The Frame Profiler activity, and the Range Profiler tool window, have been removed.
Don’t worry! The key profiling information is still available, only in a different form. This post guides you through the steps in GPU Trace, for each familiar workflow in the Range Profiler.
In this post, I answer the following questions:
- As a new user of GPU Trace, what should my workflow look like?
- Where can I find each piece of data, previously shown in the Range Profiler?
Application launch
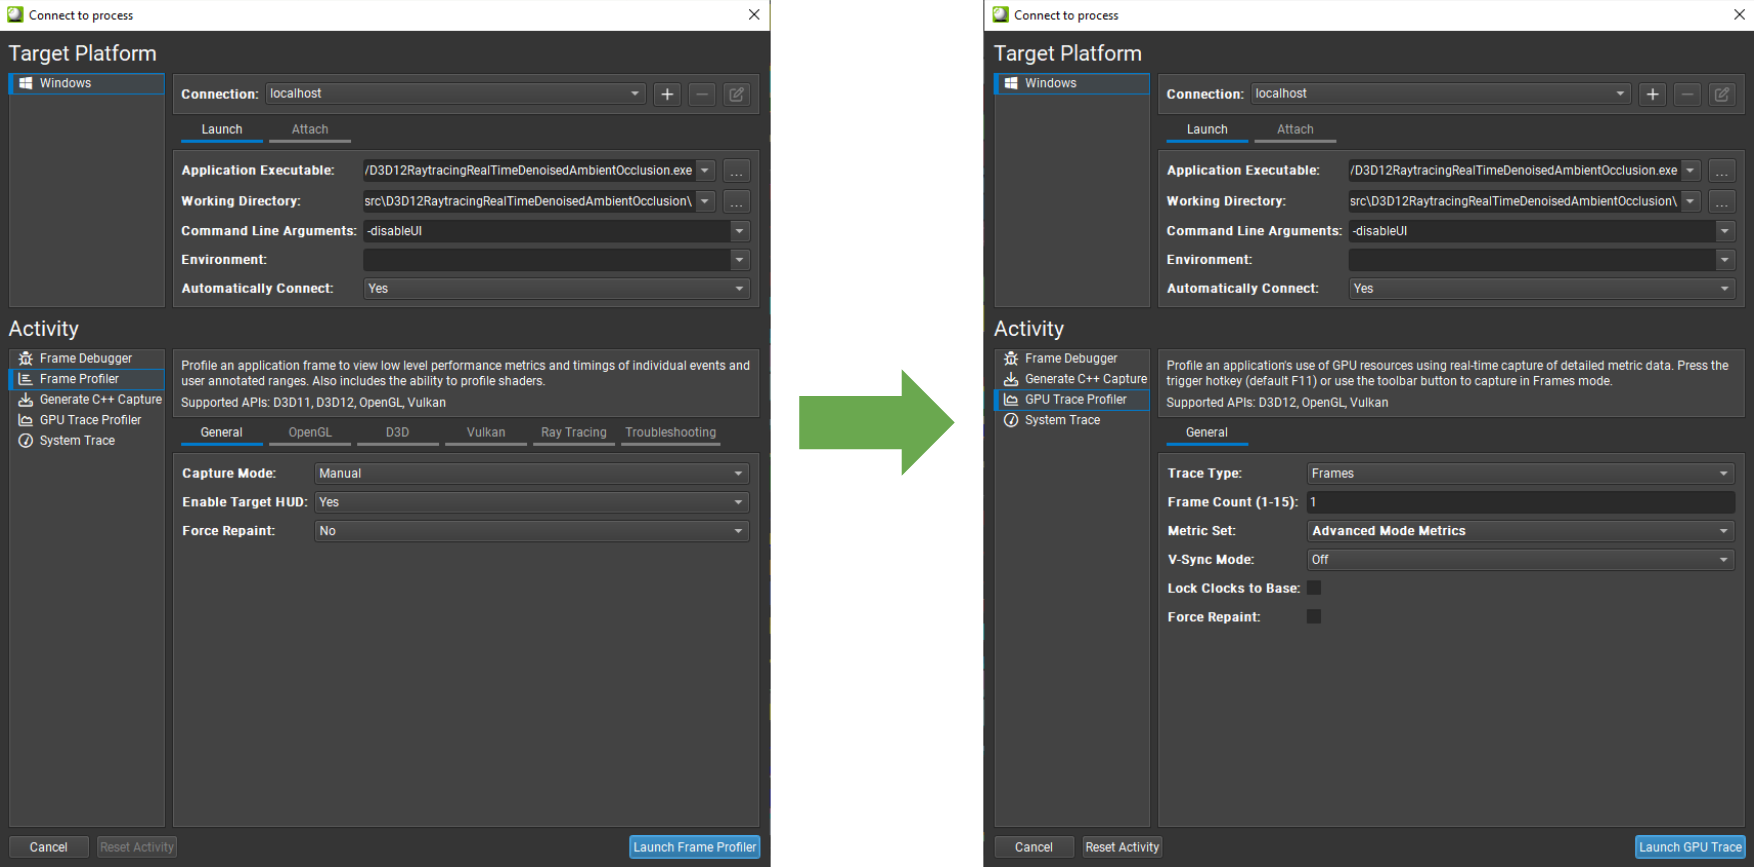
Previously, to access the Range Profiler, you may have used either the Frame Profiler or Frame Debugger activity, as shown on the left of Figure 1.

Now, when starting an application, select the GPU Trace Profiler option, as shown on the right of Figure 1. In the Metric Set dropdown list, you can select the metrics to appear in the timeline view. This list also includes the Advanced Mode option, which enables additional metrics to be displayed in tables and tooltips.
Data collection
Here are the previous steps for viewing profiling data with the Range Profiler:
- Press F11 in the application, or choose Capture for Live Analysis in the UI.
- Wait for the application to enter a replay loop.
- Open the Range Profiler tool window.
With GPU Trace, you can view profiling data with the following step:
- Press F11 in the application or choose Generate GPU Trace Capture.
- After the data transfer progress reaches 100%, choose Open.
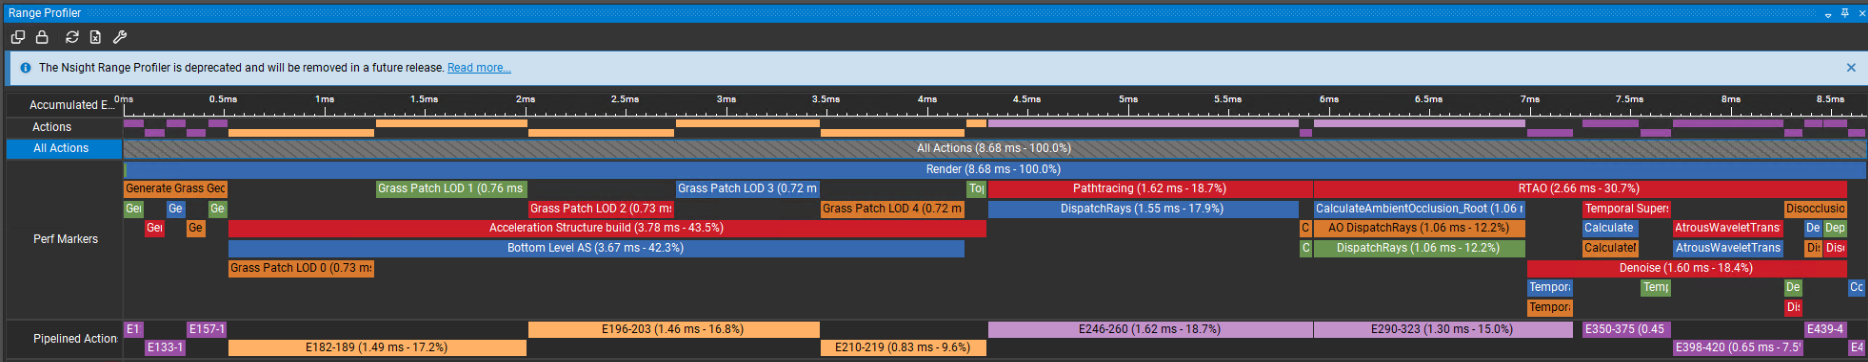
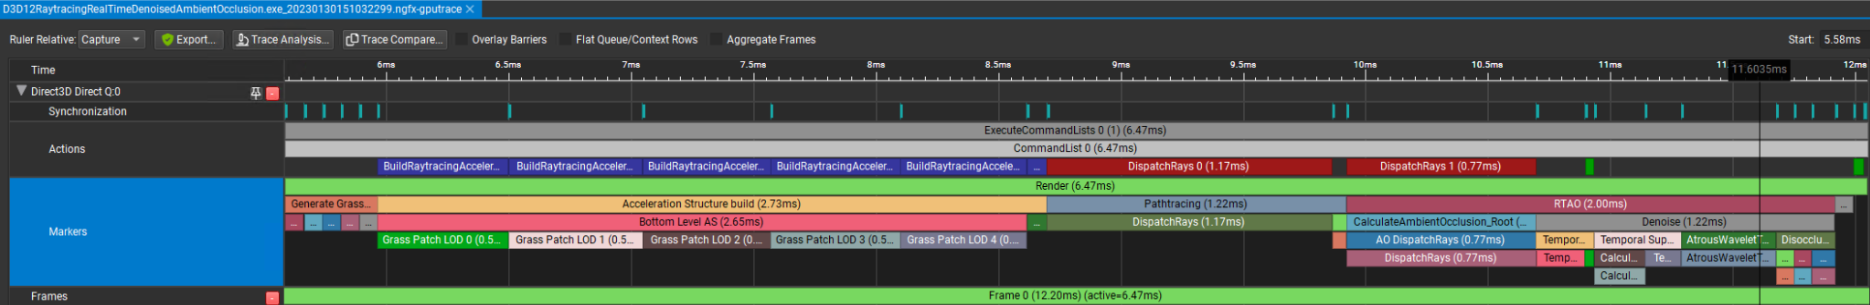
The first order of business is navigating through perf markers and actions on a timeline (draw calls, dispatches, and so on). The two tools are similar: the markers are shown on a timeline and, upon selection of a perf marker, the displayed metrics are updated.
Here are some similarities and differences between the tools:
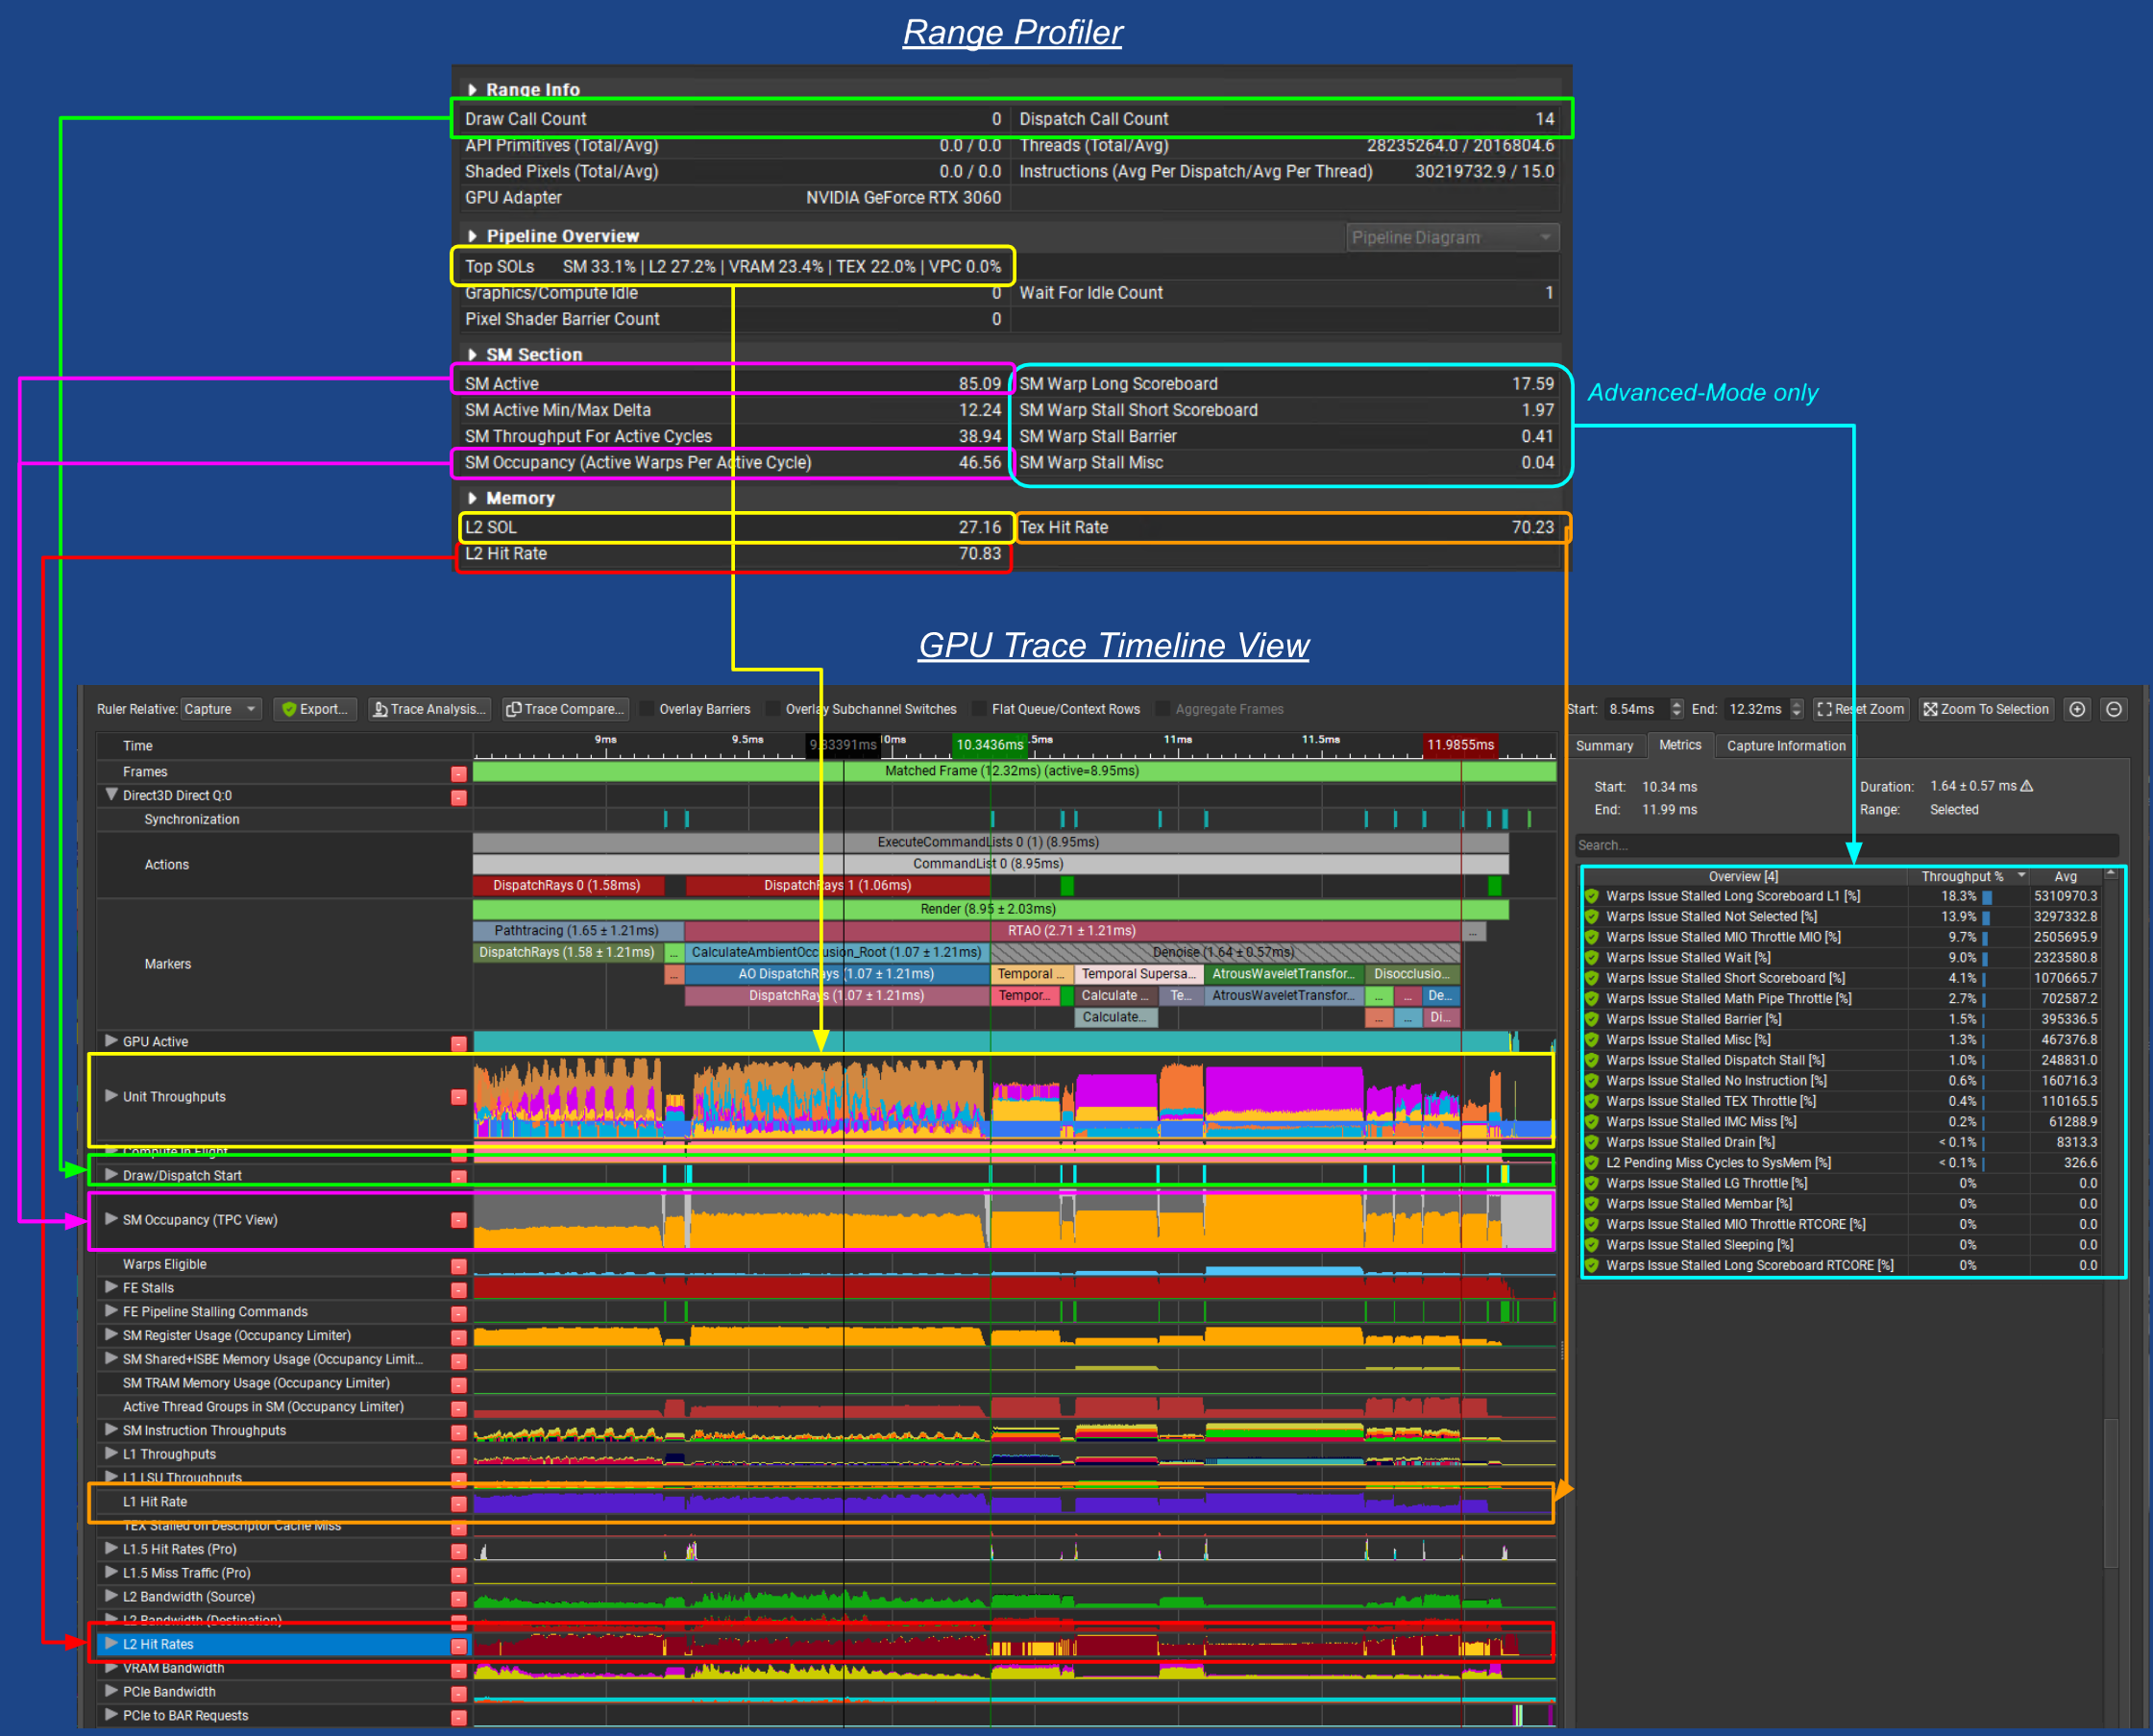
- The Range Profiler can only show total values for the entire measured region.
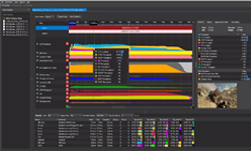
In contrast, GPU Trace is able to display time-series data for key metrics. - The most important metrics in the Range Profiler are visible on the GPU Trace timeline! Figure 4 shows the corresponding elements.
- Range-level metric values are visible in GPU Trace, in the Metrics tab on the right. The main difference is that GPU Trace accumulates sampled data, where workloads may be running in parallel; while the Range Profiler was isolating each measurement.
In GPU Trace, certain metrics are only available when the Advanced Mode metric set has been selected. For example, the Warp Stall reasons are highlighted in cyan in Figure 4.
Block diagrams
The two major visual depictions of performance metrics in the Range Profiler were the GPU block diagram and Memory block diagram.
GPU block diagram
While GPU Trace does not present a block diagram of the GPU, all stats shown within the block diagram can be found on the GPU Trace timeline, in some fashion.
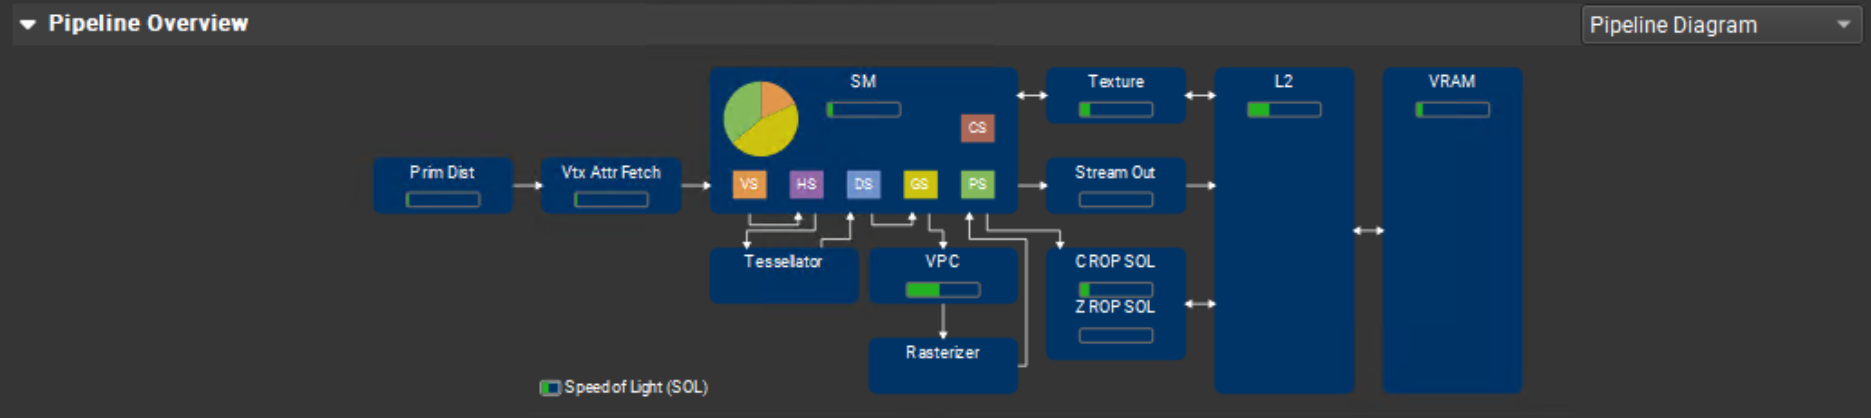
Table 1 shows the similar elements for the NVIDIA Ampere or NVIDIA Ada architectures, in the Throughput Metrics or Advanced Mode metric sets.
| Stage | Diagram element | GPU Trace row | GPU Trace metric |
| Geometry | Prim Dist | Unit Throughputs | PD Throughput |
| Geometry | Vtx Attr Fetch | Unit Throughputs | VAF Throughput |
| Geometry | VPC | Unit Throughputs | PES+VPC Throughput |
| Geometry | Stream Out | Unit Throughputs | PES+VPC Throughput |
| Rasterization | Rasterizer[1] | Unit Throughputs | RASTER Throughput |
| Rasterization | ZROP SOL | Unit Throughputs | ZROP Throughput |
| Rasterization | CROP SOL | Unit Throughputs | CROP Throughput |
| Shading | SM | Unit Throughputs | SM Throughput |
| Shading | SM Pie Chart | SM Instruction | SM Issue Active[2] |
| Shading | SM Pie Chart | SM Occupancy | Warps per Shader Stage[2] |
| Memory | Texture | Unit Throughputs | L1 Throughput[3] |
| Memory | L2 | Unit Throughputs | L2 Throughput |
| Memory | VRAM | Unit Throughputs | VRAM Throughput |
- Range Profiler displays no value for Raster Throughput.
- The Range Profiler’s pie chart shows instructions executed, per shader stage.
GPU Trace can measure total instructions, but a per-shader stage decomposition is only available in the Occupancy chart. - On modern GPUs, the L1TEX cache is a combined L1 Data Cache that contains a Load/Store Unit + Texture Unit. Despite the short name “L1”, it includes Texture as well.
Memory block diagram
GPU Trace does not present a block diagram of the memory hierarchy. However, each element of the Range Profiler’s memory diagram has some corresponding timeline data in GPU Trace.
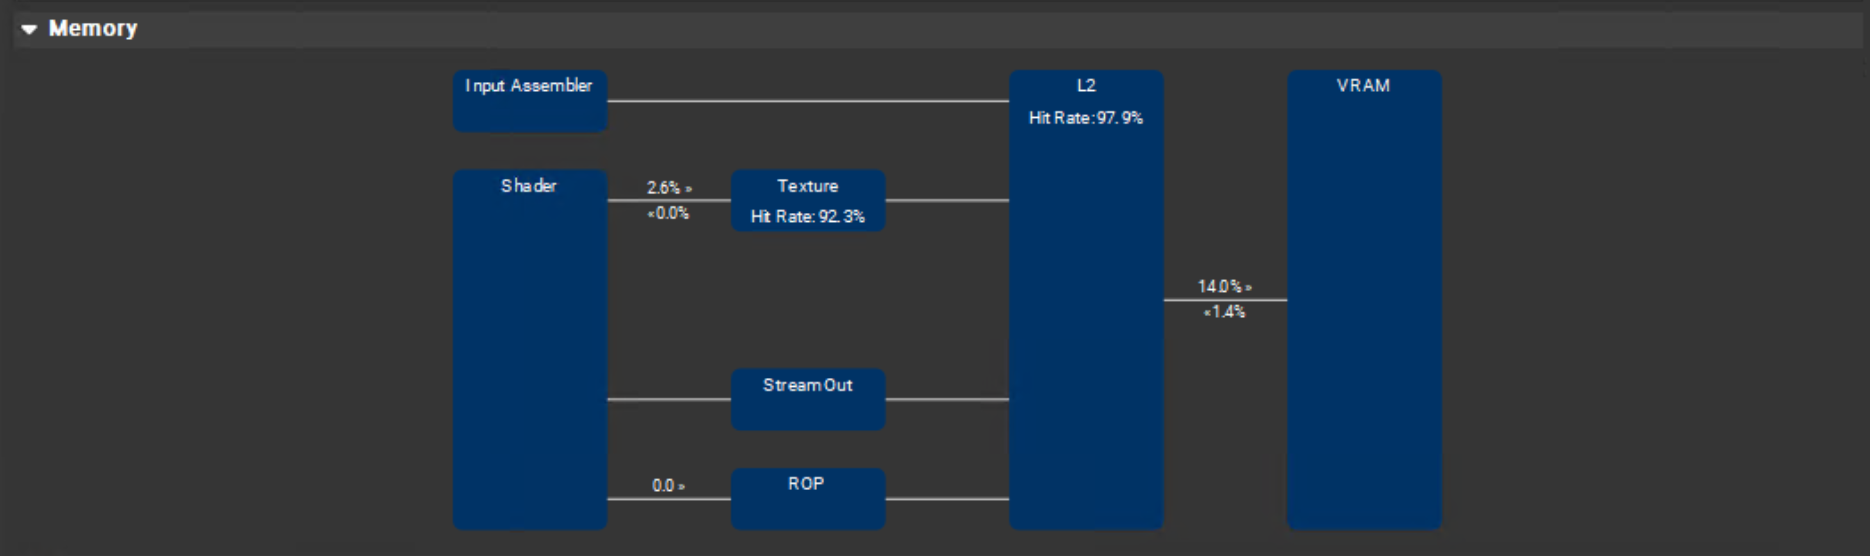
Table 2 shows the similar elements for the NVIDIA Ampere or NVIDIA Ada architectures, in the Throughput Metrics or Advanced Mode metric sets.
| Diagram element | GPU Trace row | GPU Trace metric |
| Shader → Texture | L1 Throughputs | L1 LSU Data-Stage Throughput L1 Texture Data-Stage Throughput |
| Texture → Shader | L1 Throughputs | L1 LSU Writeback-Stage Throughput L1 Texture Writeback-Stage Throughput |
| Texture Hit-Rate | L1 Hit Rate | L1 Hit Rate |
| Input Assembler → L2[4] | L2 Bandwidth | L2 Bandwidth from HUB[5] |
| Texture → L2[4] | L2 Bandwidth | L2 Bandwidth from L1[6] |
| StreamOut → L2[4] | L2 Bandwidth | L2 Bandwidth from PE[7] |
| ROP → L2[4] | L2 Bandwidth | L2 Bandwidth from CROP + L2 Bandwidth from ZROP |
| L2 Hit Rate | L2 Hit Rates | L2 Hit Rate |
| L2 → VRAM | VRAM Bandwidth | VRAM Write Bandwidth |
| VRAM → L2 | VRAM Bandwidth | VRAM Read Bandwidth |
| PCIe TX Bandwidth[8] | PCIe Bandwidth | PCIe Write Bandwidth |
| PCIe RX Bandwidth[8] | PCIe Bandwidth | PCIe Read Bandwidth |
- Range Profiler does not display any values for “memory requests to L2”.
- HUB traffic includes the Primitive Distributor, Copy Engines, and a few other units.
- “L1” is short for L1TEX, and includes both Load/Store and Texture bandwidth.
- Primitive Engine traffic may include internal operations, in addition to streamout.
- Range Profiler does not display PCIe bandwidth.
What about the Shader Profiler?
In Nsight Graphics 2023.1, the Shader Profiler continues to be available through the Frame Debugger activity.
The Shader Profiler is an essential part of a holistic profiling workflow, providing HLSL and GLSL source-level performance stats. Using it with GPU Trace can provide a complete picture of why frame performance is low, and the specific reasons each shader is achieving less than optimal performance.
For more information about how this works, see the following resources:
- Identifying Shader Limiters with the Shader Profiler in NVIDIA Nsight Graphics
- How to Improve Shader Performance By Resolving LDC Divergence (video)
Conclusion
The Nsight Graphics GPU Trace Profiler activity provides the same or better levels of information as the Range Profiler. In most cases, metrics are displayed over time, rather than as a single number, revealing the real-time performance characteristics of concurrent GPU workloads.
NVIDIA continues to develop and improve GPU Trace, helping you to extract maximum performance on each new powerful architecture and programming model. To get started, download the latest version of Nsight Graphics.
If you have questions or comments, reach out through the NVIDIA Developer forums or email us at NsightGraphics@nvidia.com. Remember to file any bugs you find using the integrated Feedback button on the top right of the tool window. For videos on how to use the tools and best practices from our experts, subscribe to the NVIDIA Game Developer YouTube channel.
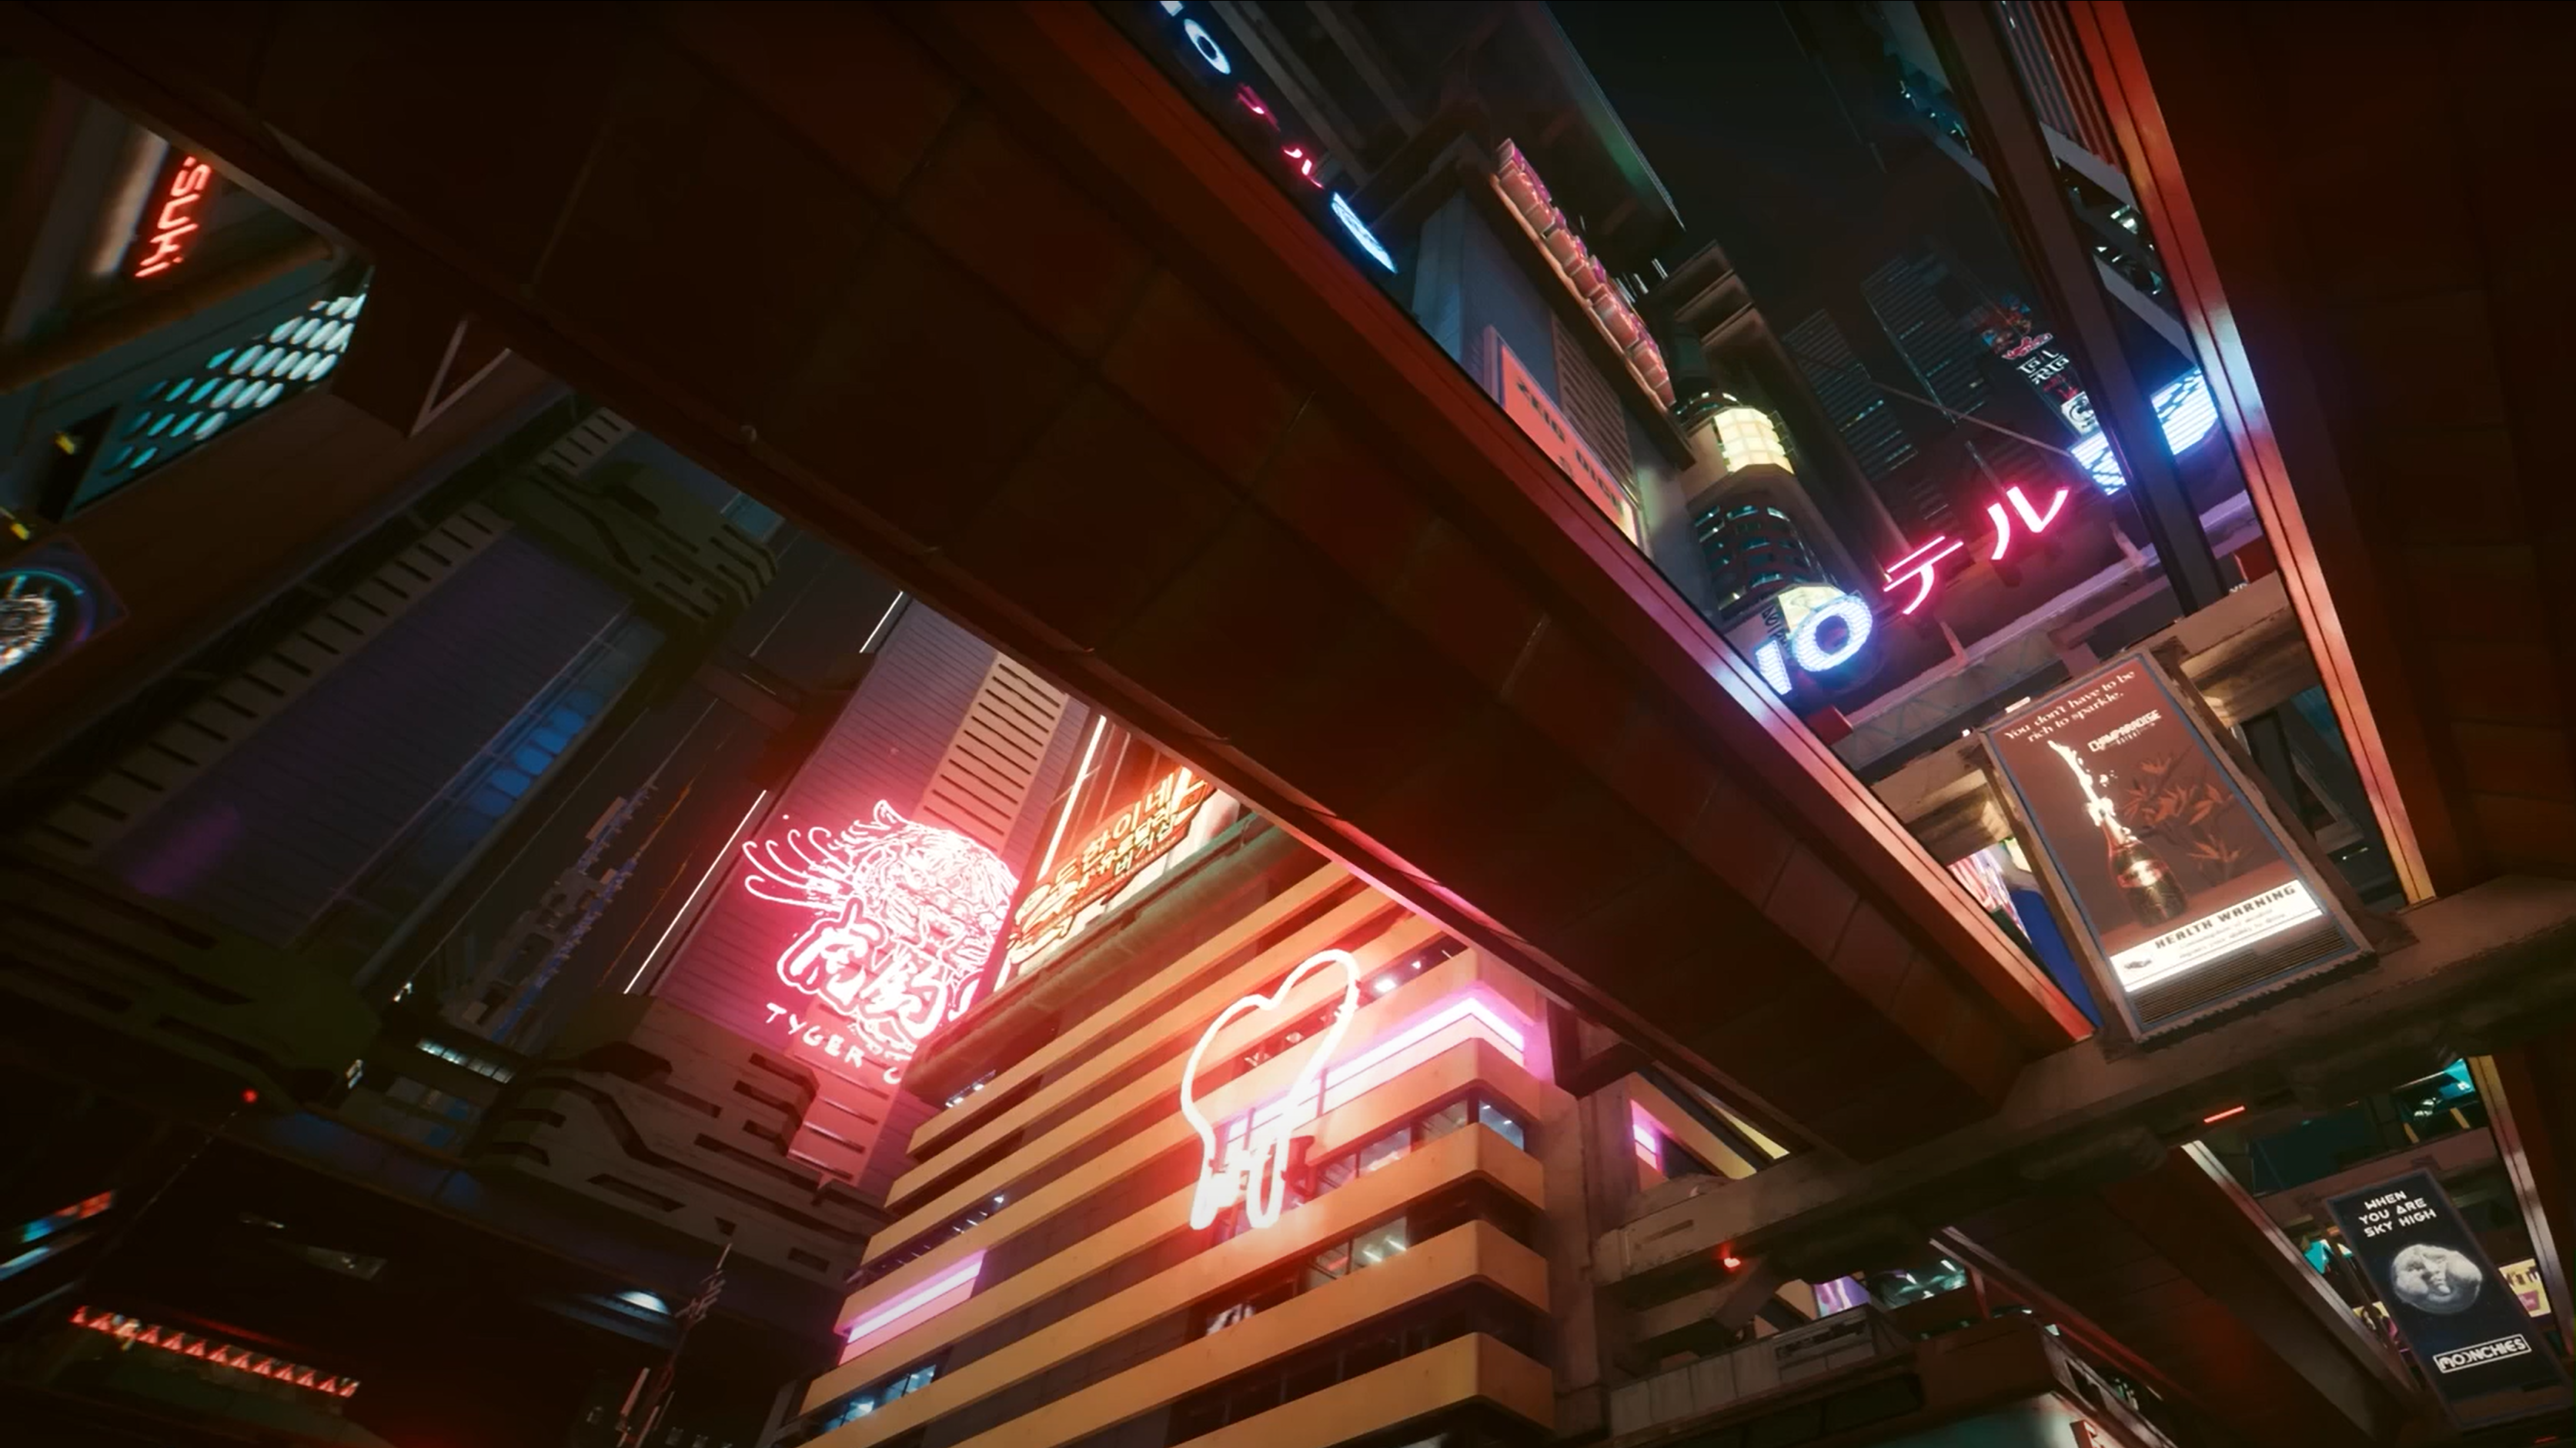
Watch the GDC demo video to see how GPU Trace was used to optimize path tracing in Cyberpunk 2077: How Cyberpunk 2077 Achieved Photorealistic Graphics with NVIDIA’s Tools – YouTube.
For more information about GPU Trace and its many applications, see the following resources:
- Advanced API Performance: Async Compute and Overlap
- Identifying Shader Limiters with the Shader Profiler in NVIDIA Nsight Graphics
- Building Acceleration Structures Using Async Compute (video)
- How to Improve Shader Performance by Resolving LDC Divergence (video)
- Getting Started with Ray Tracing Graphics Tools | NVIDIA On-Demand (GTC session)
Here are additional resources across a wider array of profiling tools:
- Uplifting Optimizations, Debugging, and Performance Tuning with NVIDIA Nsight Developer Tools
- NVIDIA Developer Tools – Walkthrough of Development Scenarios and Solutions – YouTube
- Building Games with NVIDIA Nsight Tools on NVIDIA Ada Lovelace – YouTube
Acknowledgments
Thanks to the following NVIDIA colleagues, who have contributed to this post: Louis Bavoil, Robert Jensen, Axel Mamode, and Aurelio Reis.