 Vulkan is a low-overhead, cross-platform 3D graphics and compute API targeting a wide variety of devices from cloud gaming servers, to PCs and embedded platforms. The Khronos Group?manages and defines the Vulkan API.
Introduction to NVIDIA Nsight Systems
NVIDIA?Nsight™Systems?provides developers with a unified timeline view which displays how applications use computer resources. This low-overhead performance analysis tool helps developers analyze and optimize their application’s algorithms, running across the CPU and GPU.
Nsight Systems assists identifying performance issues such as GPU starvation, unnecessary CPU and GPU synchronizations, insufficient CPU parallelization or pipelining, and unexpectedly expensive CPU or GPU algorithms. Nsight Systems employs low-overhead tracing and sampling techniques to collect process and thread activity. It correlates profiling data across CPU cores and GPU queues. This correlation enables developers to investigate bottlenecks from the “scene of the crime” back to the origins of the performance issue. ?
Nsight Systems Vulkan support
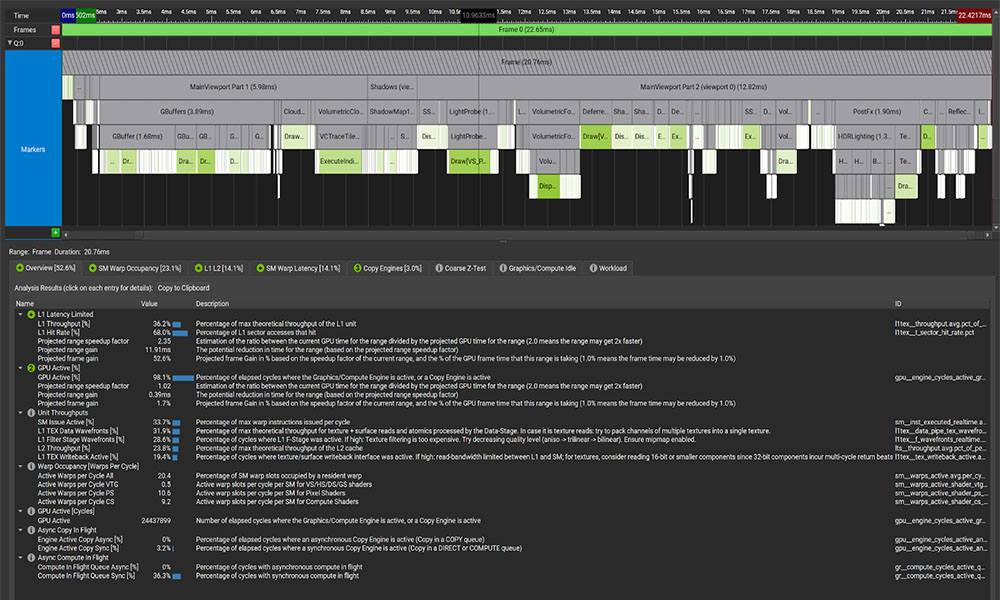
Nsight Systems release 2019.3 adds Vulkan support for Microsoft Windows and Linux operating systems. The tool?can capture information about the profiled process usage of Vulkan, including Vulkan API function execution time, corresponding GPU workloads, debug util labels, and frame durations. Both Windows x64 and Linux operating systems support Vulkan profiling. Figure 1 shows a typical timeline.
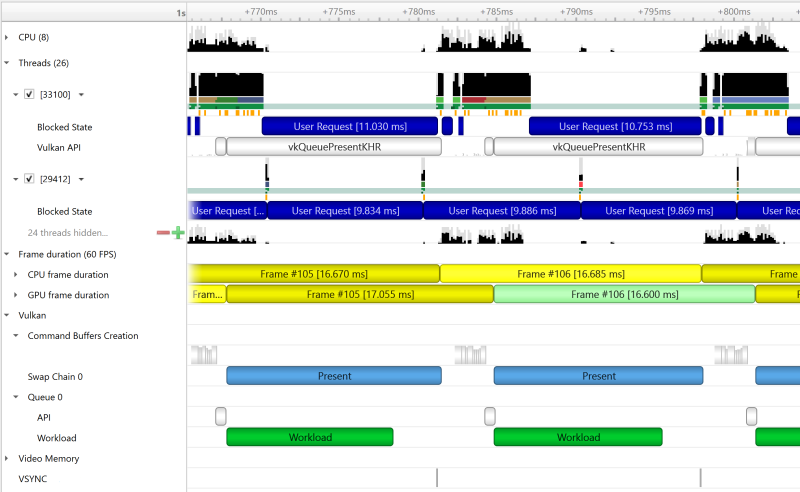
Nsight Systems Timeline
Nsight Systems displays data in a unified timeline view, combining CPU and GPU activities, together with other activities into a single timeline. The timeline comprises multiple rows, each displaying different data. Let’s dive into the timeline’s rows to see how these can help profile your Vulkan based application.
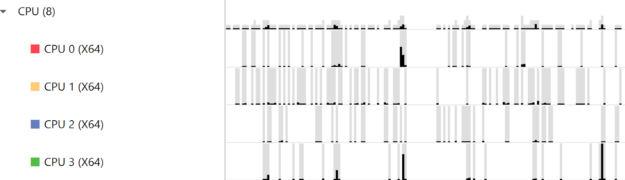
CPUs
CPU rows display how your process’ threads utilize each CPU core. This helps locating CPU cores’ idle times, as figure 2 shows.
Threads
Thread rows display a detailed view of each thread’s activities, shown in figure 3. These include CPU cores load, blocked states, call-stacks, OS runtime libraries usage, Vulkan API calls, NVTX time ranges, and Vulkan debug utils labels.
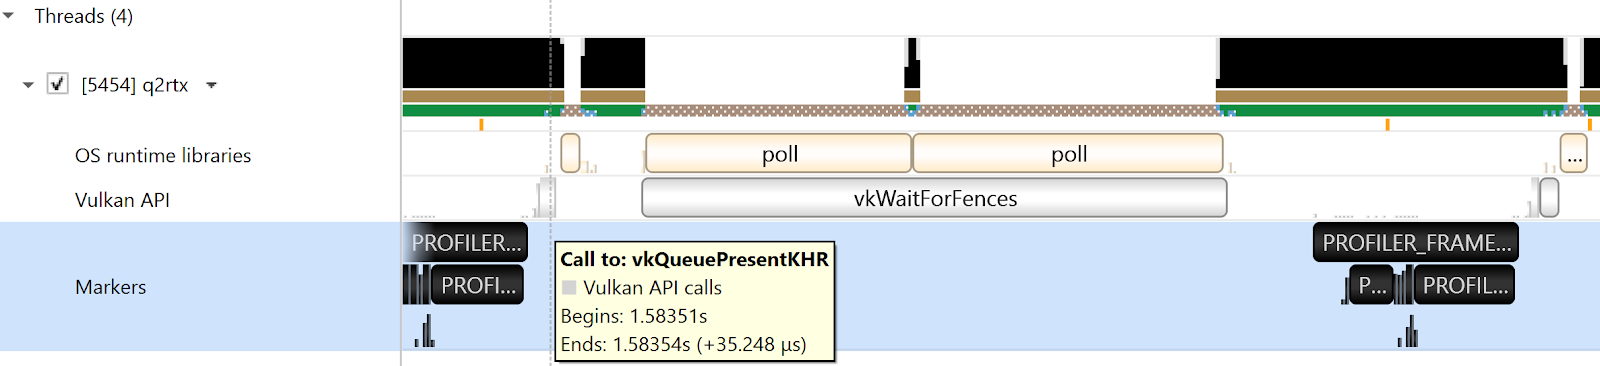
Figure 3 demonstrates threading and synchronization related issues. When a thread is blocked, contextual cues and tooltips present the blocking reason.
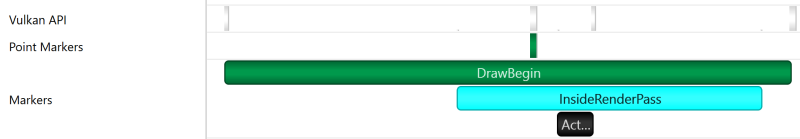
Viewing Vulkan debug utils?labels or NVIDIA NVTX?time ranges and markers on Nsight Systems’ timeline lets developers annotate the timeline with the application logic, as figure 4 shows. The correlation to the application logic greatly improve the timeline’s readability.

Command Buffer Creation
The Command Buffer Creation row shown in figure 5 displays time periods when command buffers creation. This enables developers to improve their application’s multithreaded?command buffer creation. Command buffer creation time period is measured between the call to vkBeginCommandBuffer and the call to vkEndCommandBuffer.

Swap Chains
The Swap Chain row seen in figure 6 displays the available swap chains and the time periods where vkQueuePresentKHR was executed on each swap chain.

Queue
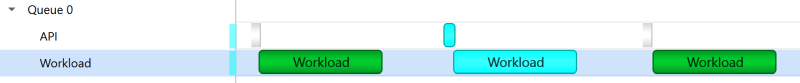
A Queue row displays?for each Vulkan queue created by the profiled application. The API sub-row displays time periods where vkQueueSubmit?was called. The GPU Workload sub-row displays time periods where GPU workloads executed.

In addition, you can see VK_EXT_debug_utils?labels on both the CPU and the GPU.
Clicking on a GPU workload highlights the corresponding vkQueueSubmit?call, and vice versa.
Stutter Analysis
Nsight Systems displays stutter analysis visualization aids to help trace these “hard to find” frame-rate stutter reasons.
Frames Duration
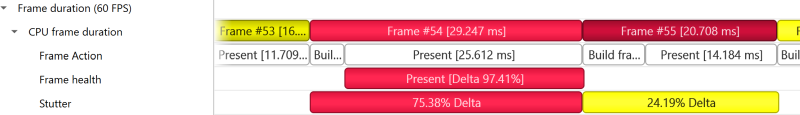
Figure 10 highlights the Frame Duration section displays frame durations on both the CPU and the GPU. ?The colors alternate tones to improve visibility.

Stutter row
The stutter row highlights frames that are significantly longer than the other frames in their immediate vicinity. You do this?by comparing the duration of each frame to the median duration of the surrounding 19 frames. This feature lets developers easily identify local frame-time stuttering. Red indicates local frame stutter greater than 50%, as shown in figure 11.
Frame Health row
The Frame Health row displays actions that took significantly longer during the current frame, compared to the median time of the same actions executed during the surrounding 19-frames. This is great at assisting users in detecting the reason for frame time stuttering. Such actions may be: shader compilation, present, memory mapping and more. Nsight Systems measures the accumulated time of such actions in each frame. For example: calculating the accumulated time of shader compilations in each frame and comparing it to the accumulated time of shader compilations in the surrounding 19 frames.
GPU Memory Utilization
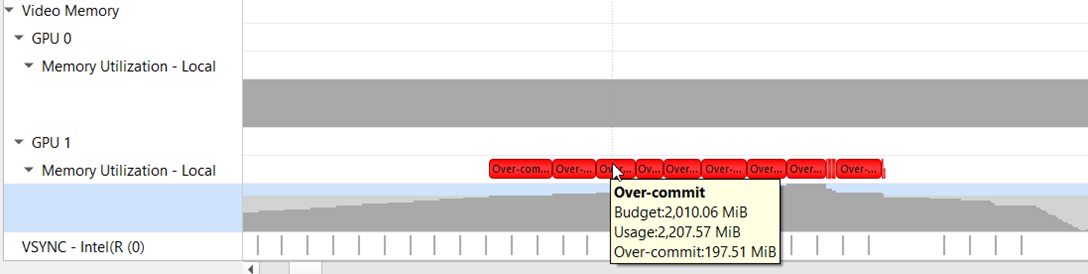
The Memory Utilization row shown in figure 12 displays the amount of local GPU memory the application uses on Windows plus the commit limit for each GPU. This helps when investigating cases where the application uses more GPU memory than it’s limit, causing it to fall-off the “GPU memory cliff”; paging out to virtual memory.
Getting Started
Nsight Systems is free to download and use. It can be downloaded from http://www.open-lab.net/nsight-systems. Vulkan support requires 64-bit Windows and Linux running on NVIDIA GPUs. You’ll need NVIDIA driver version 418.56 or higher.