With the latest Memgraph Advanced Graph Extensions (MAGE) release, you can now run GPU-powered graph analytics from Memgraph in seconds, while working in Python.?Powered by NVIDIA cuGraph, the following graph algorithms now execute on GPU:?
- PageRank (graph analysis)
- Louvain (community detection)
- Balanced Cut (clustering)
- Spectral Clustering (clustering)
- HITS (hubs versus authorities analytics)
- Leiden (community detection)
- Katz centrality
- Betweenness centrality
This tutorial shows you how to use PageRank graph analysis and Louvain community detection to analyze a Facebook dataset containing 1.3M relationships. I discuss the following tasks:
- Import data inside Memgraph using Python
- Run analytics on large-scale graphs and get fast results
- Run analytics on NVIDIA GPUs from Memgraph
Tutorial prerequisites
To follow this graph analytics tutorial, you need an NVIDIA GPU, driver, and container toolkit. After you have successfully installed the NVIDIA GPU driver and container toolkit, you must also install the following tools:
- Docker for running
mage-cugraphimage - Jupyter for analyzing the graph data
- GQLAlchemy to connect Memgraph with Python
- Memgraph Lab for visualizing the graph
The next section walks you through installing and setting up these tools for the tutorial.

Docker
Docker is used to install and run the mage-cugraph Docker image:?
- Download Docker.
- Download the tutorial data.
- Run the Docker image, giving it access to the tutorial data.
Download Docker
You can install Docker by visiting the Docker webpage and following the instructions for your operating system.
Download the tutorial data
Before running the mage-cugraph Docker image, first download the data to be used in the tutorial. This enables you to give the Docker image access to the tutorial dataset when run.??
To download the data, use the following commands to clone the jupyter-memgraph-tutorials GitHub repo, and move it to?the jupyter-memgraph-tutorials/cugraph-analytics folder:
Git clone https://github.com/memgraph/jupyter-memgraph-tutorials.git
Cd jupyter-memgraph-tutorials/cugraph-analytics
Run the Docker image
You can now use the following command to run the Docker image and mount the workshop data to the /samples folder:
docker run -it -p 7687:7687 -p 7444:7444 --volume /data/facebook_clean_data/:/samples mage-cugraphWhen you run the Docker container, you should see the following message:
You are running Memgraph vX.X.X
To get started with Memgraph, visit https://memgr.ph/start
With the mount command executed, the CSV files needed for the tutorial are located inside the /samples folder within the Docker image, where Memgraph finds them when needed.
Install the Jupyter notebook
Now that Memgraph is running, install Jupyter. This tutorial uses JupyterLab, and you can install it with the following command:
pip install jupyterlabWhen JupyterLab is installed, launch it with the following command:
jupyter labGQLAlchemy?
Use GQLAlchemy, an object graph mapper (OGM), to connect to Memgraph and also execute queries in Python. You can think of Cypher as SQL for graph databases. It contains many of the same language constructs such as Create, Update, and Delete.?
Download CMake on your system, and then you can install GQLAlchemy with pip:
pip install gqlalchemyMemgraph Lab?
The last prerequisite to install is Memgraph Lab. You use it to create data visualizations upon connecting to Memgraph. Learn how to install Memgraph Lab as a desktop application for your operating system.
With Memgraph Lab installed, you should now connect to your Memgraph database.
At this point, you are finally ready to:
- Connect to Memgraph with GQLAlchemy
- Import the dataset
- Run graph analytics in Python
Connect to Memgraph with GQLAlchemy
First, position yourself in the Jupyter notebook. The first three lines of code import gqlalchemy, connect to Memgraph database instance via host:127.0.0.1 and port:7687, and clear the database. Be sure to start with a clean slate.
from gqlalchemy import Memgraph
memgraph = Memgraph("127.0.0.1", 7687)
memgraph.drop_database()
Import the dataset from CSV files.
Next, you perform PageRank and Louvain community detection using Python.
Import data
The Facebook dataset consists of eight CSV files, each having the following structure:
node_1,node_2
0,1794
0,3102
0,16645
Each record represents an edge connecting two nodes. Nodes represent the pages, and relationships are mutual likes among them.
There are eight distinct types of pages (Government, Athletes, and TV shows, for example). Pages have been reindexed for anonymity, and all pages have been verified for authenticity by Facebook.
As Memgraph imports queries faster when data has indices, create them for all the nodes with the label Page on the id property.
memgraph.execute(
    """
    CREATE INDEX ON :Page(id);
    """
)
Docker already has container access to the data used in this tutorial, so you can list through the local files in the ./data/facebook_clean_data/ folder. By concatenating both the file names and the /samples/ folder, you can determine their paths. Use the concatenated file paths to load data into Memgraph.
import os
from os import listdir
from os.path import isfile, join
csv_dir_path = os.path.abspath("./data/facebook_clean_data/")
csv_files = [f"/samples/{f}" for f in listdir(csv_dir_path) if isfile(join(csv_dir_path, f))]
Load all CSV files using the following query:
for csv_file_path in csv_files:
    memgraph.execute(
        f"""
        LOAD CSV FROM "{csv_file_path}" WITH HEADER AS row
        MERGE (p1:Page {{id: row.node_1}})
        MERGE (p2:Page {{id: row.node_2}})
        MERGE (p1)-[:LIKES]->(p2);
        """
    )
For more information about importing CSV files with LOAD CSV, see the Memgraph documentation.
Next, use PageRank and Louvain community detection algorithms with Python to determine which pages in the network are most important, and to find all the communities in a network.
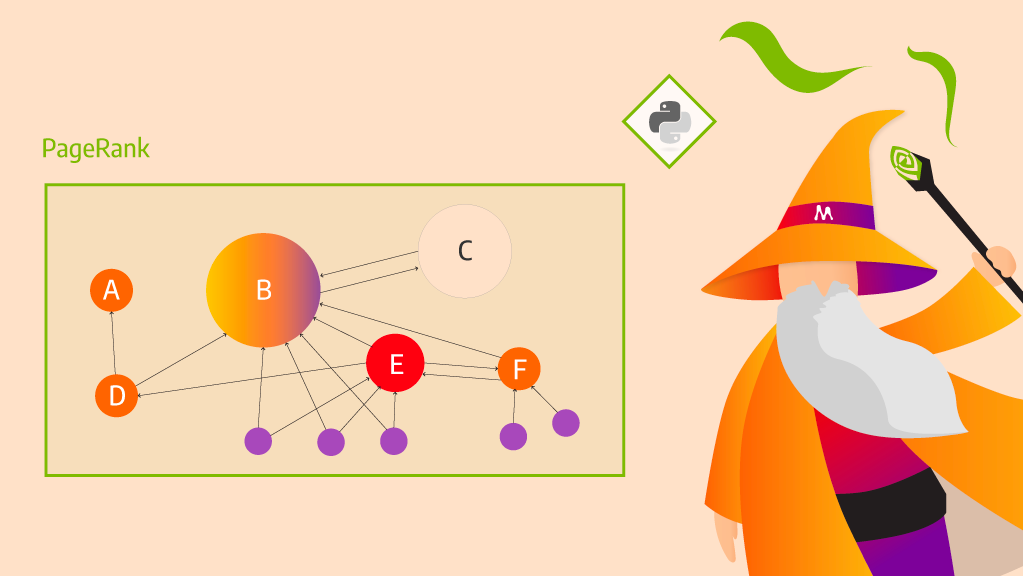
PageRank importance analysis
To identify important pages in a Facebook dataset, you execute PageRank. For more information about different algorithm settings, see cugraph.pagerank.
There are also other algorithms integrated within MAGE. Memgraph should help with the process of running graph analytics on large-scale graphs. For more information about running these analytics, see other Memgraph tutorials.
MAGE is integrated to simplify executing PageRank. The following query first executes the algorithm and then creates and sets the rank property of each node to the value that the cugraph.pagerank algorithm returns.
The value of that property is then saved as a variable rank. This test and all tests presented in this post were executed on an NVIDIA GeForce GTX 1650 Ti GPU and an Intel Core i5-10300H CPU at 2.50 GHz with 16GB RAM, and returned results in around four seconds.??
 memgraph.execute(
        """
        CALL cugraph.pagerank.get() YIELD node,rank
        SET node.rank = rank;
        """
    )
Next, retrieve ranks using the following Python call:
results =  memgraph.execute_and_fetch(
        """
        MATCH (n)
        RETURN n.id as node, n.rank as rank
        ORDER BY rank DESC
        LIMIT 10;
        """
    )
for dict_result in results:
    print(f"node id: {dict_result['node']}, rank: {dict_result['rank']}")

node id: 50493, rank: 0.0030278728385218327
node id: 31456, rank: 0.0027350282311318468
node id: 50150, rank: 0.0025153975342989345
node id: 48099, rank: 0.0023413620866201052
node id: 49956, rank: 0.0020696403564964
node id: 23866, rank: 0.001955167533390466
node id: 50442, rank: 0.0019417018181751462
node id: 49609, rank: 0.0018211204462452515
node id: 50272, rank: 0.0018123518843272954
node id: 49676, rank: 0.0014821440895415787
This code returns 10 nodes with the highest rank score. Results are available in a dictionary form.
Now, it is time to visualize results with Memgraph Lab. In addition to creating beautiful visualizations powered by D3.js and our Graph Style Script language, you can use Memgraph Lab on the following tasks:
- Query graph database and write your graph algorithms in Python, C++, or even Rust
- Check the Memgraph database logs
- Visualize graph schema
Memgraph Lab comes with a variety of prebuilt datasets to help you get started.?Open Execute Query view in Memgraph Lab and run the following query:
MATCH (n)
WITH n
ORDER BY n.rank DESC
LIMIT 3
MATCH (n)<-[e]-(m)
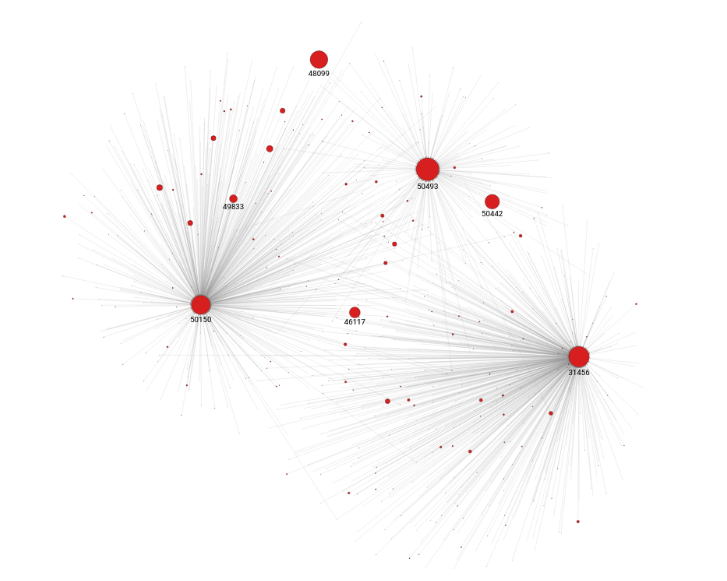
RETURN *;The first part of this query uses MATCH on all the nodes. The second part of the query uses ORDER on all nodes by their rank in descending order.
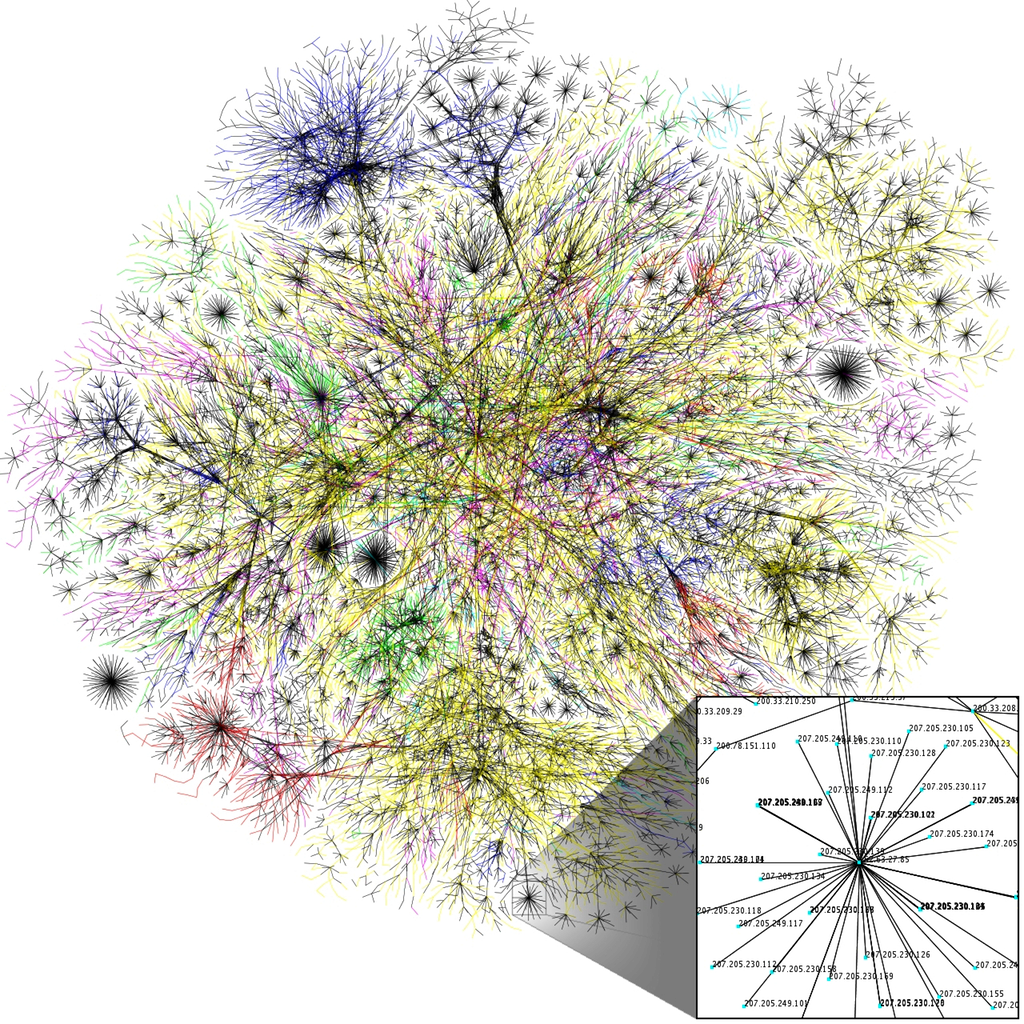
For the first three nodes, obtain all pages connected to them. You need the WITH clause to connect the two parts of the query. Figure 1 shows the PageRank query results.
The next step is learning how to use Louvain community detection to find communities present in the graph.
Community detection with Louvain
The Louvain algorithm measures the extent to which the nodes within a community are connected, compared to how connected they would be in a random network. It also recursively merges communities into a single node and executes the modularity clustering on the condensed graphs. This is one of the most popular community detection algorithms.
Using Louvain, you can find the number of communities within the graph.? First, execute Louvain and save the cluster_id value as a property for every node:
memgraph.execute(
    """
    CALL cugraph.louvain.get() YIELD cluster_id, node
    SET node.cluster_id = cluster_id;
    """
)
To find the number of communities, run the following code:
results =  memgraph.execute_and_fetch(
        """
        MATCH (n)
        WITH DISTINCT n.cluster_id as cluster_id
        RETURN count(cluster_id ) as num_of_clusters;
        """
    )
# you will get only 1 result
result = list(results)[0]

#don't forget that results are saved in a dict
print(f"Number of clusters: {result['num_of_clusters']}")

Number of clusters: 2664
Next, take a closer look at some of these communities. For example, you may find nodes that belong to one community but which are connected to another node that belongs in the opposing community. Louvain attempts to minimize the number of such nodes, so you should not see many of them.
In Memgraph Lab, execute the following query:
MATCH  (n2)<-[e1]-(n1)-[e]->(m1)
WHERE n1.cluster_id != m1.cluster_id AND n1.cluster_id = n2.cluster_id
RETURN *
LIMIT 1000;
This query uses MATCH on node n1 and its relationship to two other nodes n2 and m1 with the following parts, respectively: (n2)<-[e1]-(n1) and (n1)-[e]->(m1). Then, it filters out only those nodes where cluster_id of n1 and n2 is not the same as the cluster_id of node m1.
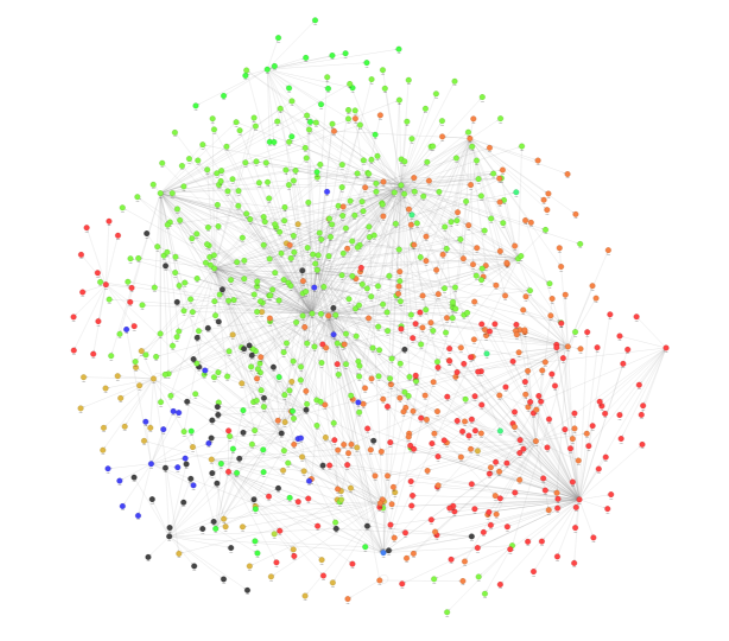
Use LIMIT 1000 to show only 1,000 of such relationships, for visualization simplicity.
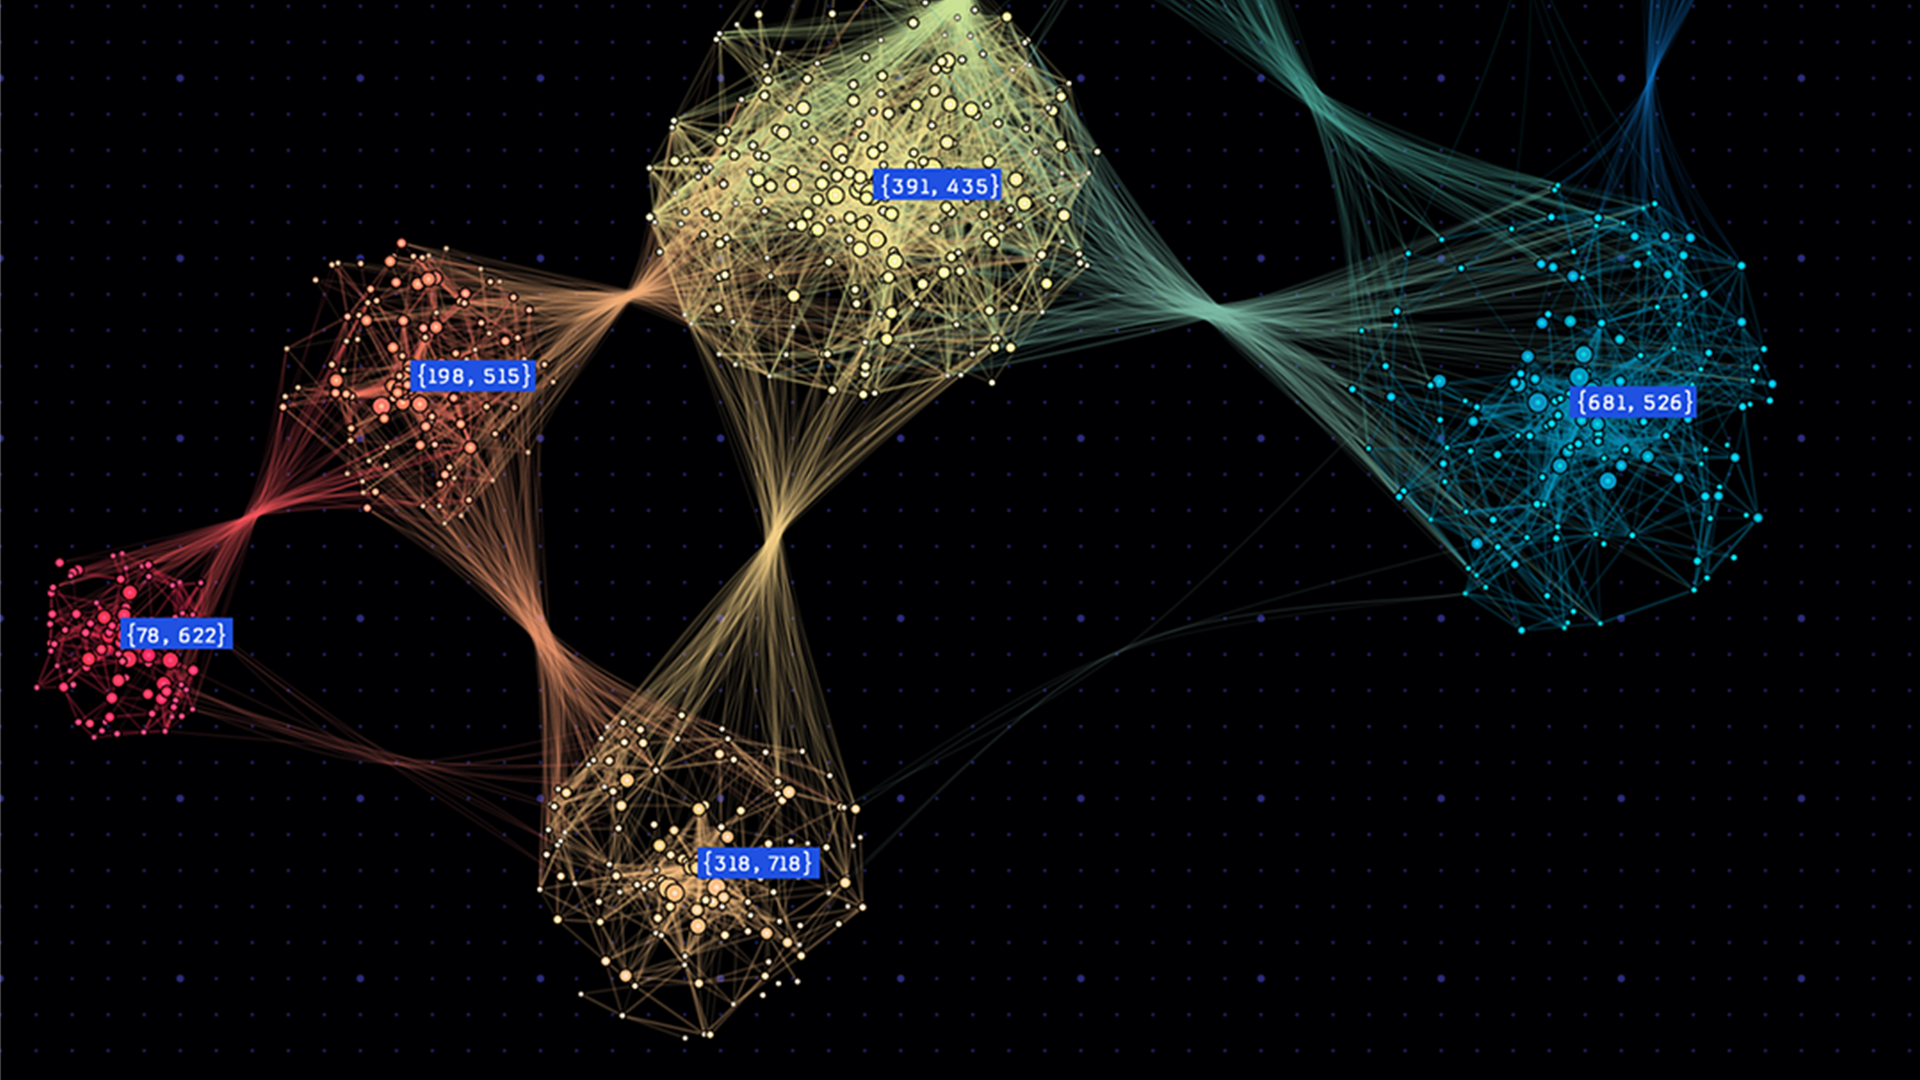
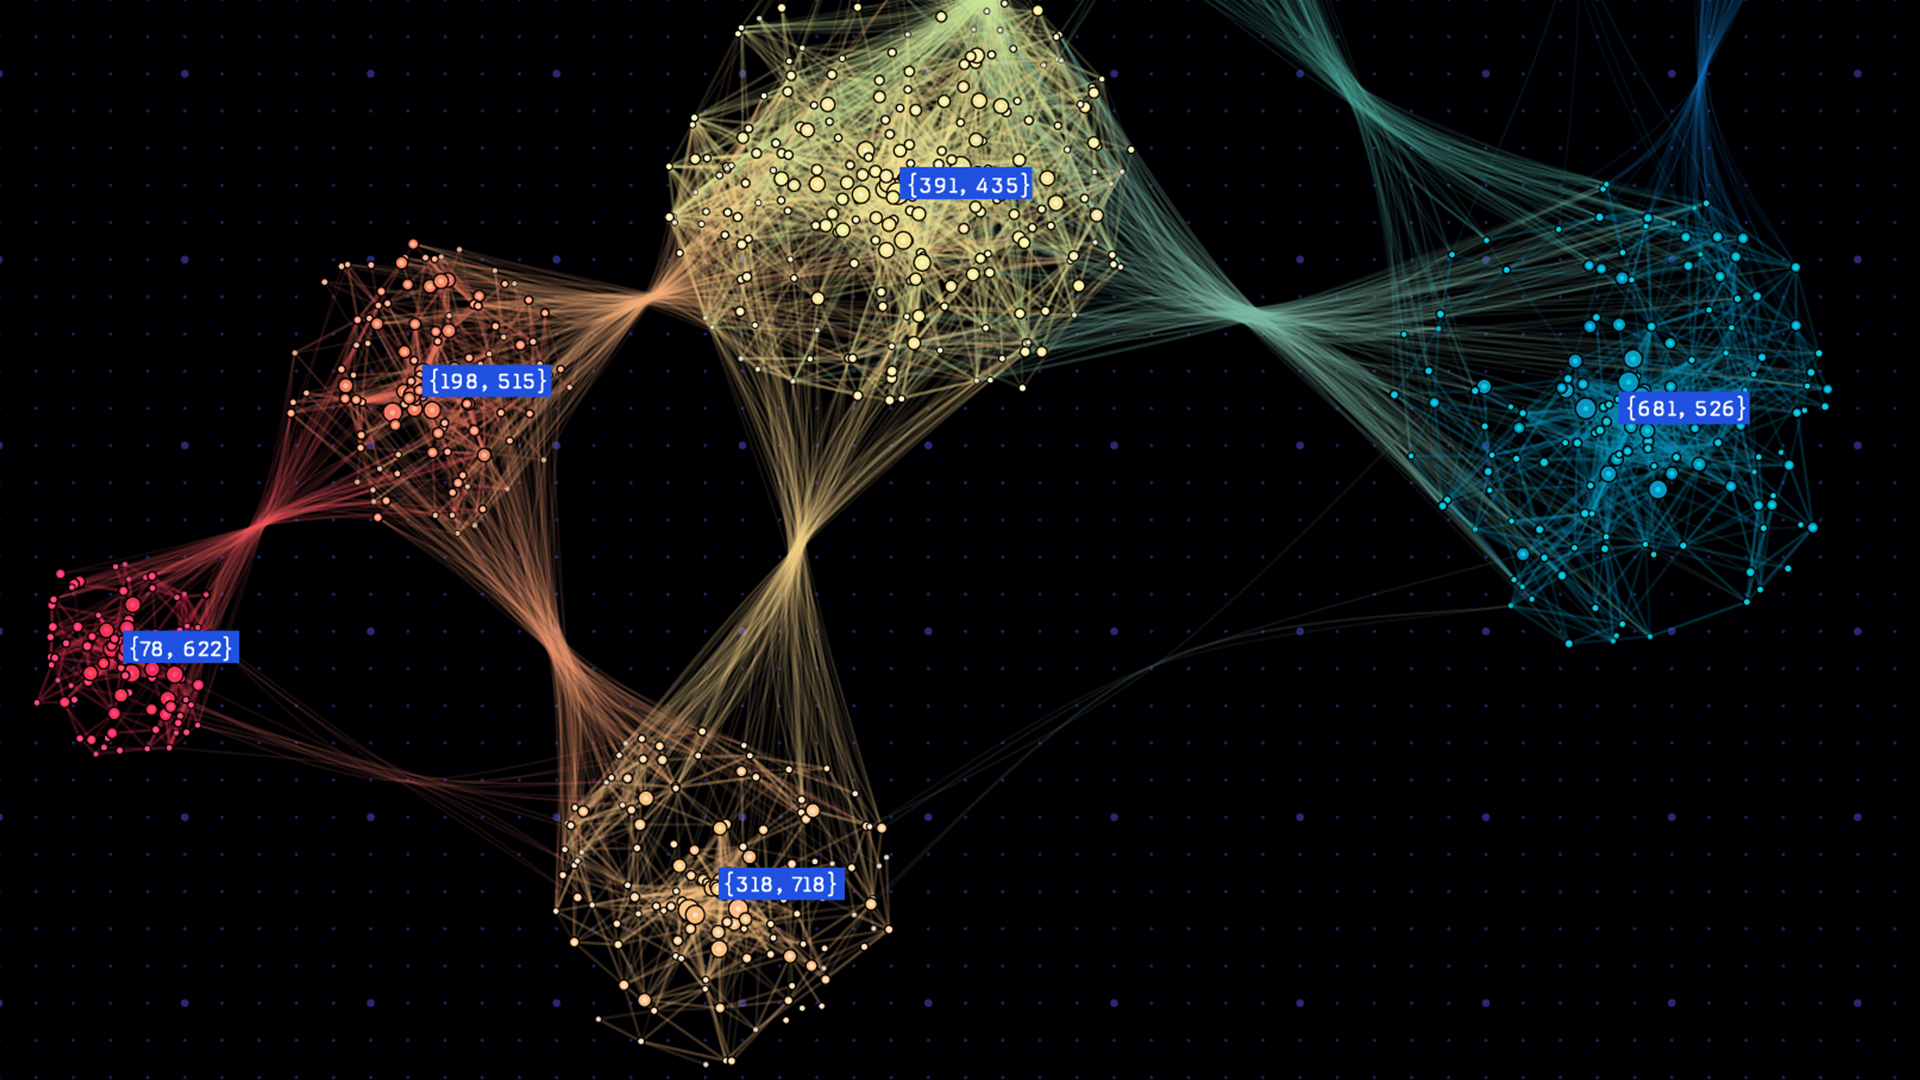
Using Graph Style Script in Memgraph Lab, you can style your graphs to, for example, represent different communities with different colors. Figure 2 shows the Louvain query results.
Summary
There you have it: millions of nodes and relationships imported using Memgraph and analyzed using the cuGraph PageRank and Louvain graph analytics algorithms. With GPU-powered graph analytics from Memgraph, powered by NVIDIA cuGraph, you are able to explore massive graph databases and carry out inference without having to wait for results.?
For more tutorials covering a variety of techniques, see Memgraph Tutorials.