GPUs are specially designed to crunch through massive amounts of data at high speed. They have a large amount of compute resources, called streaming multiprocessors (SMs), and an array of facilities to keep them fed with data: high bandwidth to memory, sizable data caches, and the capability to switch to other teams of workers (warps) without any overhead if an active team has run out of data.
]]> ]]>
]]> ]]>
]]>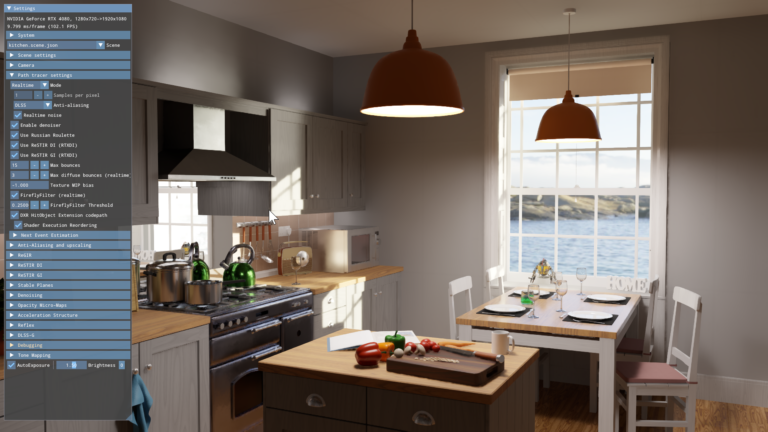
As ray tracing becomes the predominant rendering technique in modern game engines, a single GPU RayGen shader can now perform most of the light simulation of a frame. To manage this level of complexity, it becomes necessary to observe a decomposition of shader performance at the HLSL or GLSL source-code level. As a result, shader profilers are now a must-have tool for optimizing ray tracing.
]]> ]]>
]]>
NVIDIA Nsight Developer Tools provide comprehensive access to NVIDIA GPUs and graphics APIs for performance analysis, optimization, and debugging activities. When using advanced rendering techniques like ray tracing or path tracing, Nsight tools are your companion for creating a smooth and polished experience. At SIGGRAPH 2023, NVIDIA hosted a lab exploring how to use NVIDIA Nsight Tools to��
]]>
The latest release of CUDA Toolkit 12.2 introduces a range of essential new features, modifications to the programming model, and enhanced support for hardware capabilities accelerating CUDA applications. Now out through general availability from NVIDIA, CUDA Toolkit 12.2 includes many new capabilities, both major and minor. The following post offers an overview of many of the key��
]]> ]]>
]]>
NVIDIA Nsight Systems is a comprehensive tool for tracking application performance across CPU and GPU resources. It helps ensure that hardware is being efficiently used, traces API calls, and gives insight into inter-node network communication by describing how low-level metrics sum to application performance and finding where it can be improved. Nsight Systems can scale to cluster-size��
]]>
NVIDIA Nsight Compute is an interactive kernel profiler for CUDA applications. It provides detailed performance metrics and API debugging through a user interface and a command-line tool. Nsight Compute 2022.2 includes features to expand the supported environments and workflows for CUDA kernel profiling and optimization. Download now. >> The following outlines the feature highlights of��
]]>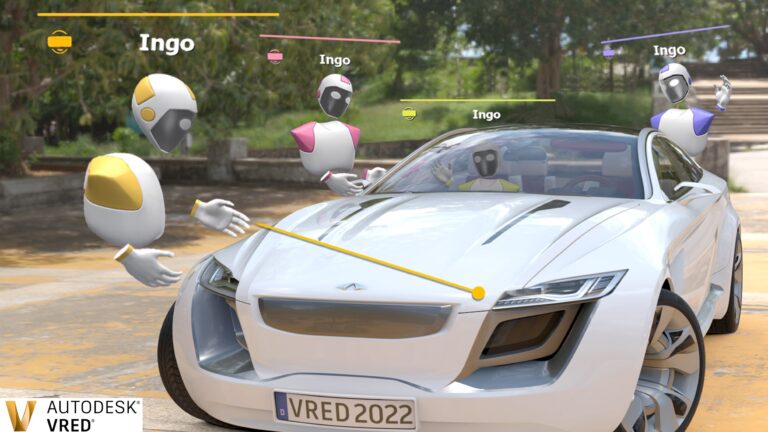
Developers and early access users can now accurately capture and replay VR sessions for performance testing, scene troubleshooting, and more with NVIDIA Virtual Reality Capture and Replay (VCR.) The potentials of virtual worlds are limitless, but working with VR content poses challenges, especially when it comes to recording or recreating a virtual experience. Unlike the real world��
]]>
The latest update to NVIDIA Nsight Systems��a performance analysis tool designed to help developers tune and scale software across CPUs and GPUs��is now available for download. Nsight Systems 2022.1 introduces several improvements aimed to enhance the profiling experience. Nsight Systems is part of the powerful debugging and profiling NVIDIA Nsight Tools Suite. A developer can start with��
]]>
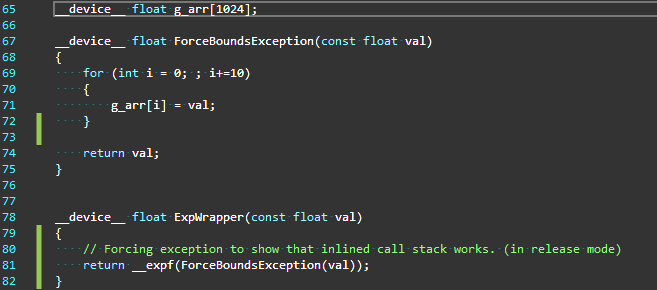
Today, NVIDIA announced the latest Nsight Graphics 2022.1, which supports Direct3D (11, 12, DXR), Vulkan 1.3 ray tracing extension, OpenGL, OpenVR, and the Oculus SDK. NVIDIA Nsight Graphics is a standalone developer tool that enables you to debug, profile, and export frames built with high-fidelity, 3D-graphic applications. Download NVIDIA Nsight Graphics now.
]]>
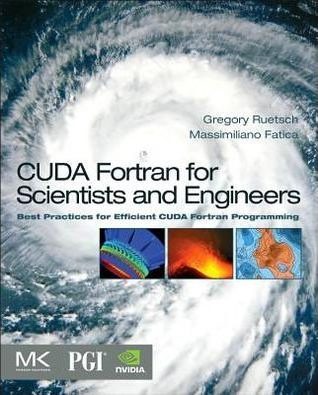
The 11.2 CUDA C++ compiler incorporates features and enhancements aimed at improving developer productivity and the performance of GPU-accelerated applications. The compiler toolchain gets an LLVM upgrade to 7.0, which enables new features and can help improve compiler code generation for NVIDIA GPUs. Link-time optimization (LTO) for device code (also known as device LTO)��
]]>
We��ve all been there. Your CUDA Fortran code is humming along and suddenly you get a runtime error: , , usually accompanied by in all caps. In many cases, the error message gives you enough information to find where the problem is in your source code: you have a runtime error and you only perform a few host-to-device transfers, or your code ran fine before you added that block of code earlier��
]]>
NVIDIA Nsight Eclipse Edition is a full-featured, integrated development environment that lets you easily develop CUDA applications for either your local (x86) system or a remote (x86 or Arm) target. In this post, I will walk you through the process of remote-developing CUDA applications for the NVIDIA Jetson TX2, an Arm-based development kit. Note that this how-to also applies to Jetson TX1 and��
]]>
This series of blog posts aims to provide an intuitive and gentle introduction to deep learning that does not rely heavily on math or theoretical constructs. The first part of this series provided an overview of the field of deep learning, covering fundamental and core concepts. The second part of the series provided an overview of training neural networks efficiently and gave a background on the��
]]>
We often say that to reach high performance on GPUs you should expose as much parallelism in your code as possible, and we don��t mean just parallelism within one GPU, but also across multiple GPUs and CPUs. It��s common for high-performance software to parallelize across multiple GPUs by assigning one or more CPU threads to each GPU. In this post I��ll cover a common but subtle bug and a simple rule��
]]>
NVIDIA Nsight Eclipse Edition (NSEE) is a full-featured unified CPU+GPU integrated development environment(IDE) that lets you easily develop CUDA applications for either your local (x86_64) system or a remote (x86_64 or ARM) target system. In my last post on remote development of CUDA applications, I covered NSEE��s cross compilation mode. In this post I will focus on the using NSEE��s synchronized��
]]>
NVIDIA Nsight Eclipse Edition is a full-featured, integrated development environment that lets you easily develop CUDA applications for either your local (x86) system or a remote (x86 or Arm) target. In this post, I will walk you through the process of remote-developing CUDA applications for the NVIDIA Jetson TK1, an Arm-based development kit. Nsight supports two remote development modes: cross��
]]>
Visual tools offer a very efficient method for developing and debugging applications. When working on massively parallel codes built on the CUDA Platform, this visual approach is even more important because you could be dealing with tens of thousands of parallel threads. With the free NVIDIA Nsight Eclipse Edition IDE, you can quickly and easily examine the GPU memory state in a running CUDA C��
]]>