2023 年 7 月末に TAO Toolkit 5.0 がリリースされました。TAO Toolkit 5.0 ではいくつかの機能が追加されていますが、本記事ではデータの前処理、アノテーション、分析に役立つ TAO Data Service について記述します。Notebook に記載された一部のコマンドについて説明します。
TAO Data Service とは
TAO Data Service には 4 つの主要パイプラインがあります。
- DALI を使用したオフライン データ拡張
DALI はデータの前処理を GPU で高速化するソフトウェアです。オフライン Data Augmentation サービスにより、ユーザーは、トレーニング中のオンライン Augmentation でよく使用されるランダム Augmentation よりも速度の早い GPU アクセラレーションによる空間/カラー/カーネル Augmentation ルーチンでデータ拡張をすることができます。 - TAO Mask Auto-labeler (MAL) によるオート ラベリング
畫像ベースのデータセットにアノテーションを付けるのは、非常に面倒で時間がかかります。オブジェクトの周囲に適切なインスタンス マスクにラベルを付けるには、バウンディング ボックスの 10 倍の時間がかかります。TAO Mask Auto-labeler は、バウンディング ボックスがあれば、インスタンスのセグメンテーション マスクを自動的に生成するように設計されており、ラベリングの手間を大幅に削減します。 - アノテーション変換サービス
アノテーション変換サービスは、 TAO モデルで広く使用されている COCO 形式と KITTI 形式の間で、アノテーション グラウンド トゥルースを簡単に変換する方法を提供します。 - データ分析サービス
データ分析サービスは、物體検出アノテーション ファイルと畫像ファイルを分析し、洞察を作成し、オブジェクトのサイズ、オブジェクトの數など、さまざまなメトリクスに基づいてグラフとサマリーを生成します。
本記事の説明內容:
- KITTI データセットを COCO フォーマットに変換
- KITTI バウンディング ボックスのインスタンス マスクを生成するためのオート ラベリングの実行。(このインスタンス マスクはモデルによって作成されるため、pseudo マスクとも呼ばれる。)
- KITTI データセットにバウンディング ボックスのデータ修正を適用
- オリジナルの KITTI データセットと拡張された KITTI データセットの有用な統計情報を収集するために、データ分析を実行
TAO Data Service Notebook
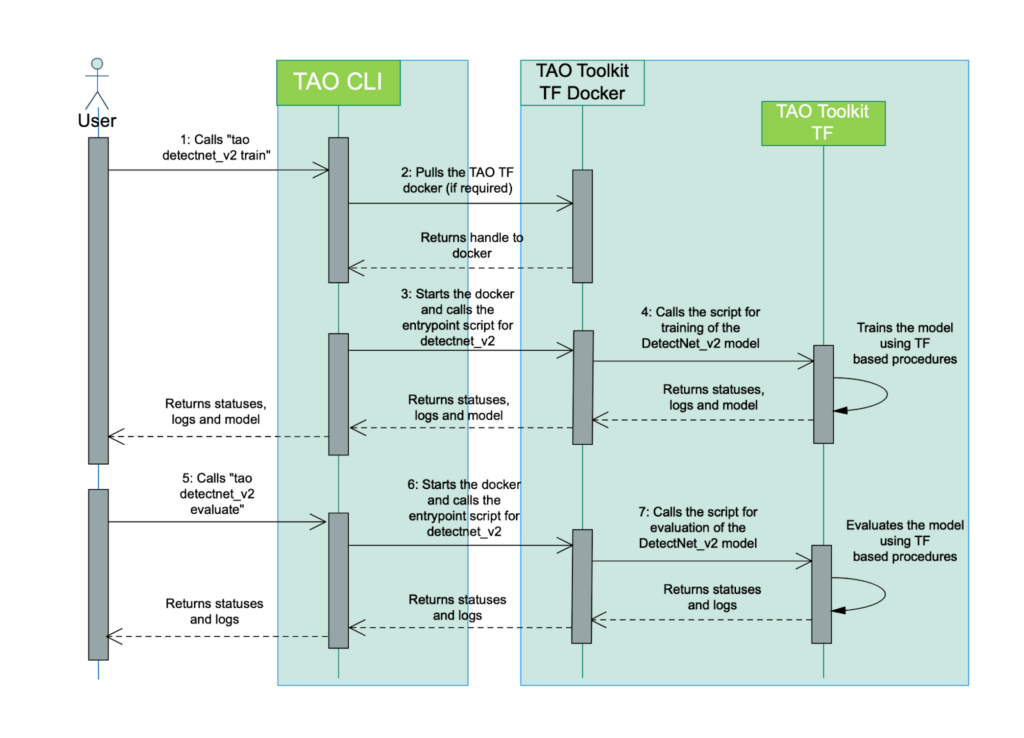
TAO Data Service はこちらの Notebook で確認できます。TAO は TAO CLI を通して Docker を pull し、Docker 內で學習、推論などを実行します。
`~/.tao_mounts.json` を使ってローカルと Docker のパスを連攜します。
source がローカルのパス、destination が docker のパスになります。DockerOptions で起動時のオプションを設定しています。
log
{
    "Mounts": [
        {
            "source": "{local project path}",
            "destination": "{container path}"
        },
        {
            "source": "{local data path}",
            "destination": "{container data path}"
        },
        {
            "source": "{local spec path}",
            "destination": "{container spec path}"
        },
        {
            "source": "{local result path}",
            "destination": "{container result path}"
        }
    ],
    "DockerOptions": {
        "shm_size": "16G",
        "ulimits": {
            "memlock": -1,
            "stack": 67108864
        },
        "network": "host"
    }
}
TAO CLI は下記のようなグループで実行されます。
- model
- dataset
- deploy
model のタスクには、TAO Toolkit がサポートする任意の DNN モデルの 1 つに対して、train、evaluate、inference を実行するルーチンが含まれています。dataset のタスクには、augment や auto_label など、データセットを操作するルーチンが含まれます。deploy のタスクには、モデルの最適化と TensorRT へのデプロイが含まれます。model の場合は下記のような CLI コマンドで実行します。
tao model <task_group> <task> <subtask> <cli_args>KITTI データを COCO フォーマットに変換する
この Notebook では、KITTI オブジェクト検出データセットを使用しています。ほとんどの TAO 物體検出モデルは、KITTI または COCO アノテーションを入力とします。ここでは 、KITTI データを COCO フォーマットへ簡単に変換する方法を示します。 変換された COCO json ファイルは、次のセクションで擬似マスクを生成するために使用されます。
COCO format:
```
    annotation{
    "id": int,
    "image_id": int,
    "category_id": int,
    "segmentation": RLE or [polygon],
    "area": float,
    "bbox": [x,y,width,height],
    "iscrowd": 0 or 1,
    }

    image{
    "id": int,
    "width": int,
    "height": int,
    "file_name": str,
    "license": int,
    "flickr_url": str,
    "coco_url": str,
    "date_captured": datetime,
    }

    categories[{
    "id": int,
    "name": str,
    "supercategory": str,
    }]
```
Notebook
!cat $HOST_SPECS_DIR/convert.yamllog
data:
input_format: "KITTI"
output_format: "COCO"
output_dir: "/results"
kitti:
image_dir: "/data/images"
label_dir: "/data/labels"
coco:
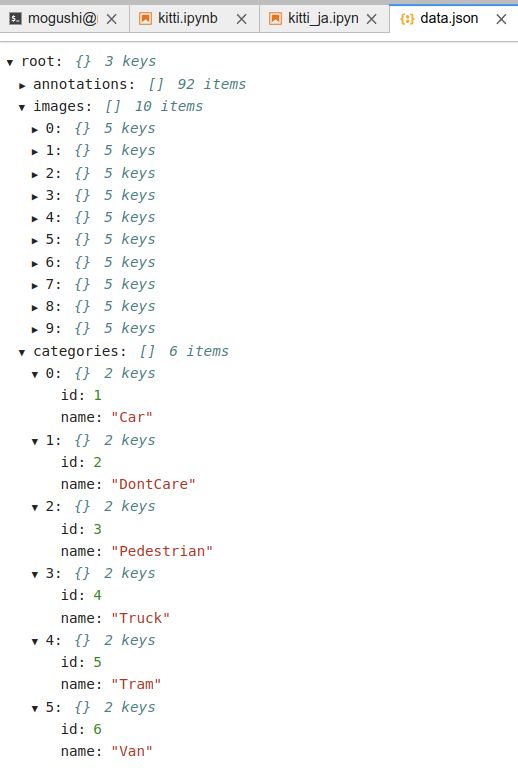
ann_file: "/results/data.json"Kitti から COCO のデータフォーマットに変換します。下記のような出力になります。
Notebook
!tao dataset annotations convert -e $SPECS_DIR/convert.yamllog
Starting Data-services Annotation conversion.
category to id mapping:
*********************
{'Car': 1, 'DontCare': 2, 'Pedestrian': 3, 'Truck': 4, 'Tram': 5, 'Van': 6}
*********************
100%|███████████████████████████████████████████| 10/10 [00:00<00:00, 86.69it/s]
Annotation conversion finished successfully.
Sending telemetry data.
Execution status: PASS
下記のようなデータが出力されます。
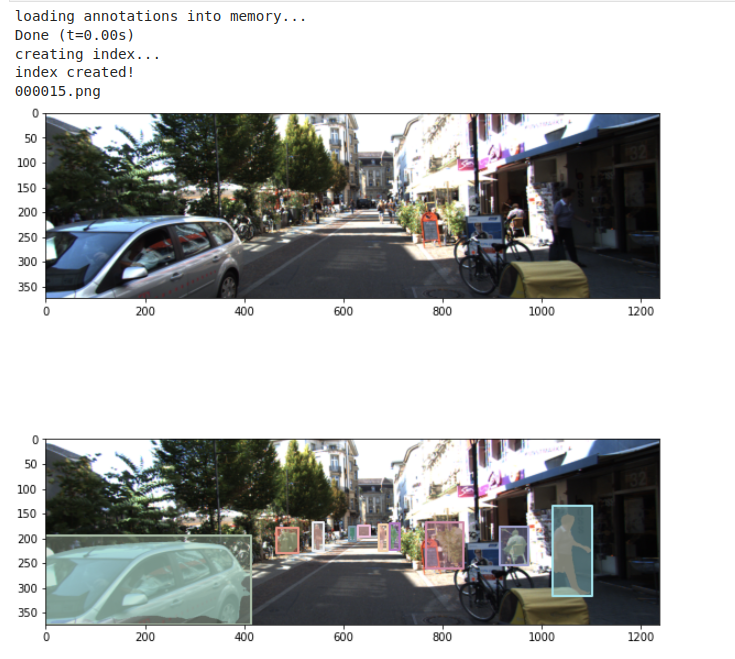
自動ラベルで擬似マスクを生成する
事前に訓練された MAL (Mask Auto-labeler) モデルを使用して、変換された KITTI データに対して擬似マスクを生成します。checkpoint と model を指定することで自分のデータで學習したモデルでマスクを生成できます。
Notebook
!cat $HOST_SPECS_DIR/autolabel.yamllog
gpu_ids: [0]
results_dir: '/results'
checkpoint: /results/mask_auto_label_vtrainable_v1.0/vit-mae-base-16epoch=10.pth
model:
  arch: vit-mae-base/16
inference:
  load_mask: False
  ann_path: '/results/data.json'
  img_dir: '/data/images'
  label_dump_path: '/results/data_mal.json'
NGC コマンドを使い、オート ラベリングで使用可能なモデルを確認します。
Notebook
# List available models
!ngc registry model list nvidia/tao/mask_auto_label:*
log
+-------+-------+-------+-------+-------+-------+------+-------+-------+
| Versi | Accur | Epoch | Batch | GPU   | Memor | File | Statu | Creat |
| on    | acy   | s     | Size  | Model | y Foo | Size | s     | ed    |
|       |       |       |       |       | tprin |      |       | Date  |
|       |       |       |       |       | t     |      |       |       |
+-------+-------+-------+-------+-------+-------+------+-------+-------+
| train |       |       | 1     | V100  | 1065. | 1.04 | UPLOA | Jul   |
| able_ |       |       |       |       | 4     | GB   | D_COM | 17,   |
| v1.0  |       |       |       |       |       |      | PLETE | 2023  |
+-------+-------+-------+-------+-------+-------+------+-------+-------+
NGC コマンドでモデルのダウンロードをします。
Notebook
# Download the model
!ngc registry model download-version nvidia/tao/mask_auto_label:trainable_v1.0 --dest $HOST_RESULTS_DIR
セグメンテーション擬似ラベルの生成を行います。
Notebook
print("For multi-GPU, change `gpus` in autolabel.yaml based on your machine.")
!tao dataset auto_label generate -e $SPECS_DIR/autolabel.yaml
下記のようなログが確認できます。
log
Starting Data-services Auto-label.
Loading validation set...
loading annotations into memory...
Done (t=0.00s)
creating index...
index created!
Validation set is loaded successfully.
Loading pretrained weights.....
Loading pretrained weights.....
Using 16bit native Automatic Mixed Precision (AMP)
GPU available: True (cuda), used: True
TPU available: False, using: 0 TPU cores
IPU available: False, using: 0 IPUs
HPU available: False, using: 0 HPUs
Initializing distributed: GLOBAL_RANK: 0, MEMBER: 1/1
Added key: store_based_barrier_key:1 to store for rank: 0
Rank 0: Completed store-based barrier for key:store_based_barrier_key:1 with 1 nodes.
----------------------------------------------------------------------------------------------------
distributed_backend=nccl
All distributed processes registered. Starting with 1 processes
----------------------------------------------------------------------------------------------------

Missing logger folder: /results/lightning_logs
Restoring states from the checkpoint path at /results/mask_auto_label_vtrainable_v1.0/vit-mae-base-16epoch=10.pth
LOCAL_RANK: 0 - CUDA_VISIBLE_DEVICES: [0]
Loaded model weights from checkpoint at /results/mask_auto_label_vtrainable_v1.0/vit-mae-base-16epoch=10.pth
Validation DataLoader 0: 100%|██████████████████| 31/31 [00:03<00:00,  8.75it/s]val/mIoU: nan
val/mIoU_small: nan
val/mIoU_medium: nan
val/mIoU_large: nan
NaN or Inf found in input tensor.
NaN or Inf found in input tensor.
NaN or Inf found in input tensor.
NaN or Inf found in input tensor.
Validation DataLoader 0: 100%|██████████████████| 31/31 [00:03<00:00,  8.66it/s]
────────────────────────────────────────────────────────────────────────────────
     Validate metric           DataLoader 0
────────────────────────────────────────────────────────────────────────────────
        val/mIoU                    nan
     val/mIoU_large                 nan
     val/mIoU_medium                nan
     val/mIoU_small                 nan
────────────────────────────────────────────────────────────────────────────────
Auto-label finished successfully.
Sending telemetry data.
Execution status: PASS
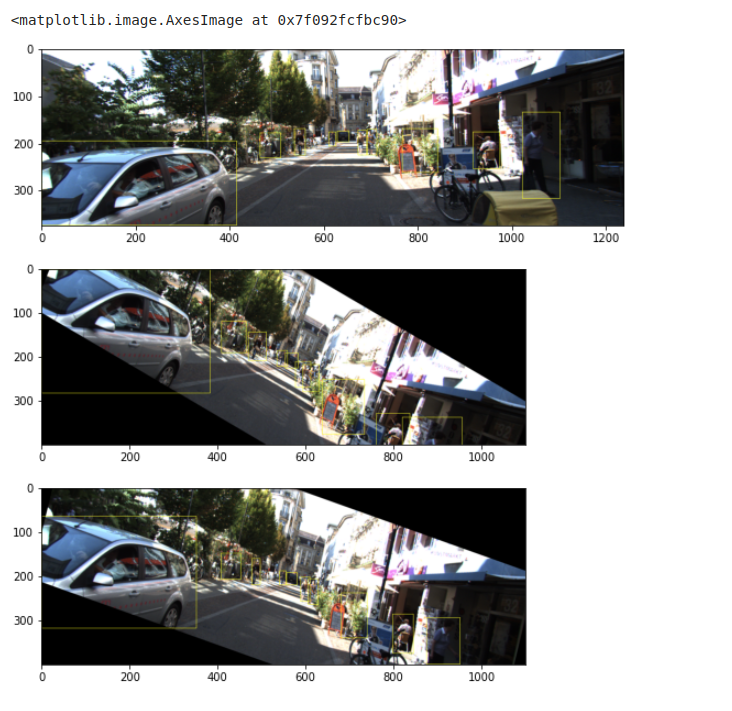
データ拡張を適用
KITTI データを用いてオフラインで Augmentation を実行します。Augmentation の過程で、歪んだり回転したバウンディング ボックスを修正するために、最後のステップで生成された擬似マスクを確認することができます。まずバウンディング ボックス 修正を使わない Augmentation を行います。
Notebook
print("For multi-GPU, change `num_gpus` in augment.yaml based on your machine.")
!tao dataset augmentation generate -e $SPECS_DIR/augment.yaml data.output_dataset=$RESULTS_DIR/augmented
データ拡張処理を行います。內部で DALI を活用して GPU によるデータの前処理を高速化しています。DALI は GPU でデータの前処理を行うソフトウェアです。大量のデータの前処理を行う際に高速化が期待できます。
Notebook
Starting Data-services Augment.
2023-08-01 02:26:47,917 - INFO - Data augmentation started. (generate.py:46)
Data augmentation started.
/usr/local/lib/python3.8/dist-packages/nvidia/dali/ops.py:649: DeprecationWarning: WARNING: `image_decoder` is now deprecated. Use `decoders.image` instead.
In DALI 1.0 all decoders were moved into a dedicated :mod:`~nvidia.dali.fn.decoders`
submodule and renamed to follow a common pattern. This is a placeholder operator with identical
functionality to allow for backward compatibility.
  op_instances.append(_OperatorInstance(input_set, self, **kwargs))
100%|███████████████████████████████████████████| 10/10 [00:00<00:00, 21.91it/s]
2023-08-01 02:26:49,661 - INFO - Data augmentation finished in 1.74s. (generate.py:115)
Data augmentation finished in 1.74s.
Augment finished successfully.
Sending telemetry data.
Execution status: PASS
バウンディング ボックス修正を含めたデータ拡張処理をします。バウンディング ボックス修正とはオフラインでデータ拡張 (回転処理) をする際にバウンディング ボックスがずれてしまうケースがあるため、それを修正する処理になります。
Notebook
print("For multi-GPU, change `num_gpus` in augment.yaml based on your machine.")
!tao dataset augmentation generate -e $SPECS_DIR/augment.yaml \
    data.output_dataset=$RESULTS_DIR/refined \
    spatial_aug.rotation.refine_box.enabled=True \
    spatial_aug.rotation.refine_box.gt_cache=$RESULTS_DIR/data_mal.json
log
Starting Data-services Augment.
2023-08-01 02:27:58,500 - INFO - Data augmentation started. (generate.py:46)
Data augmentation started.
loading annotations into memory...
Done (t=0.00s)
creating index...
index created!
/usr/local/lib/python3.8/dist-packages/nvidia/dali/ops.py:649: DeprecationWarning: WARNING: `image_decoder` is now deprecated. Use `decoders.image` instead.
In DALI 1.0 all decoders were moved into a dedicated :mod:`~nvidia.dali.fn.decoders`
submodule and renamed to follow a common pattern. This is a placeholder operator with identical
functionality to allow for backward compatibility.
  op_instances.append(_OperatorInstance(input_set, self, **kwargs))
100%|███████████████████████████████████████████| 10/10 [00:00<00:00, 16.76it/s]
2023-08-01 02:28:00,397 - INFO - Data augmentation finished in 1.90s. (generate.py:115)
Data augmentation finished in 1.90s.
Augment finished successfully.
2023-08-01 02:28:00,575 - INFO - Converting COCO json into KITTI format... (generate.py:168)
Converting COCO json into KITTI format...
loading annotations into memory...
Done (t=0.00s)
creating index...
index created!
2023-08-01 02:28:00,706 - INFO - KITTI conversion is complete. (generate.py:175)
KITTI conversion is complete.
Sending telemetry data.
Execution status: PASS
データ拡張 (2 番目の畫像) とデータ拡張を修正したデータを可視化したもの (3 番目の畫像) は下記です。3 つ目の畫像はデータ拡張した後にバウンディング ボックスを修正してサイズを調整しています。
データ分析の実行
KITTI データを使ってデータ分析を実行します。この機能は以下をサポートします:
- analyze – このタスクは入力ファイルを分析し、計算された統計のグラフを生成します。また、バウンディング ボックス付きの畫像を生成することもできます。グラフは、ユーザーの入力に応じて、ローカルまたは wandb 上で生成することができます。
- validate – このタスクは、無効な座標、不均衡データを計算することによって入力ファイルを検証し、データを修正する必要があるかどうかを提案します。
データ分析仕様の提供
データ分析パラメータを設定するための spec ファイルを提供します。
- data:
- input_format: “KITTI”
- output_dir: “/results/analytics”
- image_dir: “/data/images”
- ann_path: “/data/labels”
- workers: 2
- image:
- generate_image_with_bounding_box: False
- sample_size: 100
- graph:
- generate_summary_and_graph: True
- height: 15
- width: 15
- show_all: False
- wandb:
- visualize: False
- project: “tao data analytics”
- image セクションは、バウンディング ボックスを含む畫像を生成するかどうかを設定します。
- graph セクションは、生成されるグラフの高さと幅を設定します。graph.show_all パラメーターは、生成されるグラフ上のすべてのアノテーション データを可視化するかどうかを決定します。
- wandb セクションは、wandb 上でグラフを生成するかどうかを設定します。デフォルトでは、すべてのグラフと畫像は data.output_dir フォルダ內にローカルに生成されます。
Notebook
!cat $HOST_SPECS_DIR/analytics.yamllog
data:
  input_format: "KITTI"
  output_dir: "/results/analytics"
  image_dir: "/data/images"
  ann_path: "/data/labels"
workers: 2
image:
  generate_image_with_bounding_box: False
  sample_size: 100
graph:
  generate_summary_and_graph: True
  height: 15
  width: 15
  show_all: False
wandb:
  visualize: False
  project: "tao data analytics"
ローカル データの可視化によるデータ分析を行います。アノテーション ファイルが分析され、インサイト グラフがローカルに生成されます。
Notebook
!tao dataset analytics analyze -e $SPECS_DIR/analytics.yamllog
Starting Data-services KITTI analysis.
Created Graphs inside /results/analytics folder
Kitti analysis finished successfully.
Sending telemetry data.
Execution status: PASS
作成された graphs のディレクトリ直下に pdf ファイルがあります。
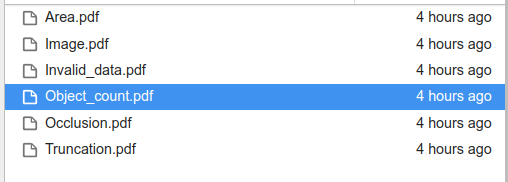
Object_count.pdf でオブジェクトごとのクラス數などを確認できます。
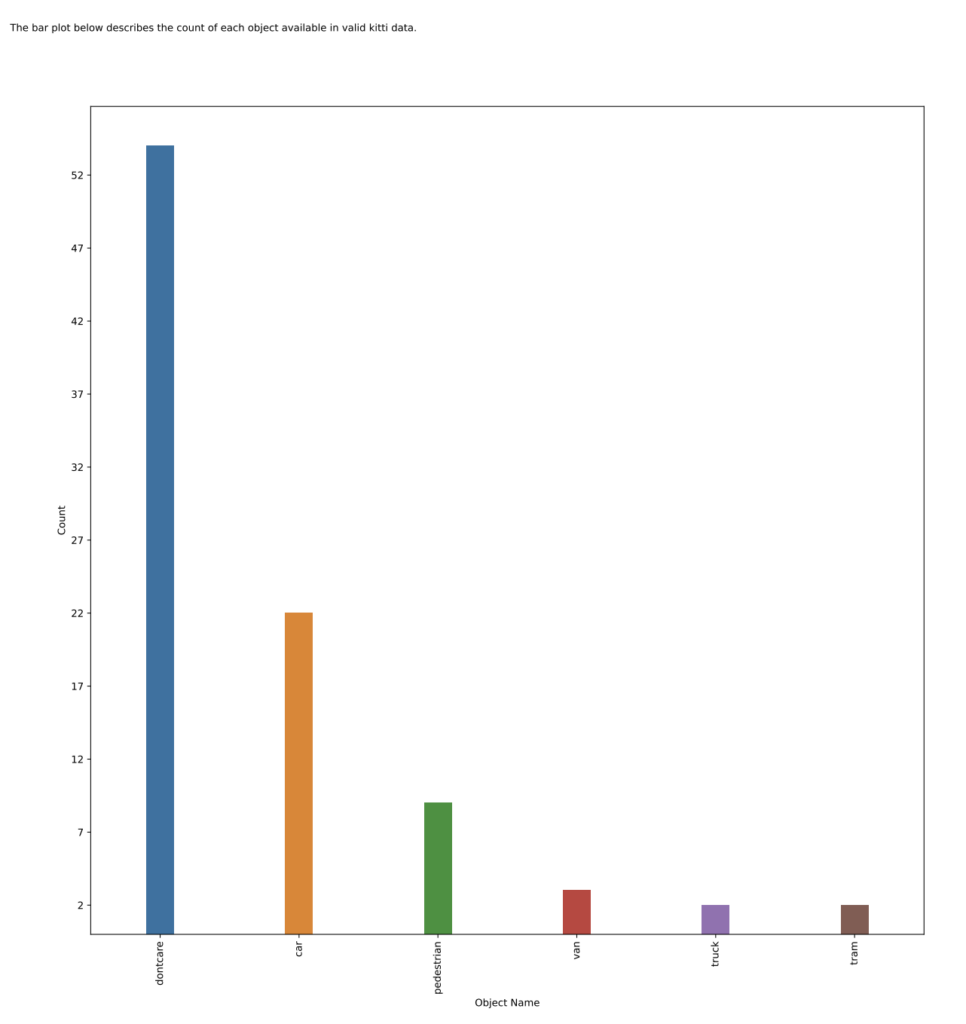
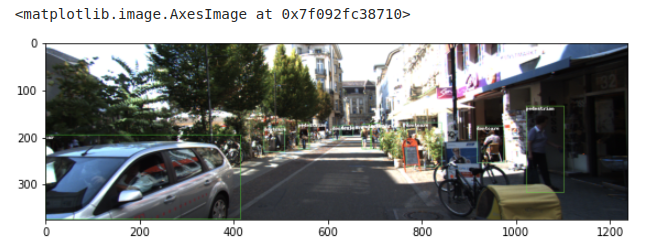
image.generate_image_with_bounding_box=True を設定することで、グラフとバウンディング ボックス付き畫像をローカルに生成します。
Notebook
!tao dataset analytics analyze -e $SPECS_DIR/analytics.yaml image.generate_image_with_bounding_box=Truelog
Starting Data-services KITTI analysis.
Created Graphs inside /results/analytics folder
Generating images with bounding boxes and labels.
Total image files- 10
100%|███████████████████████████████████████████| 10/10 [00:00<00:00, 14.88it/s]
Images with bounding boxes are available at /results/analytics/image_with_bounding_boxes
Kitti analysis finished successfully.
Sending telemetry data.
Execution status: PASS
Wandb 可視化によるデータ分析
ここではデータを視覚化し、洞察を明らかにするために Weights & Biases を使用しています。Weights & Biases をセットアップするには、wandb 統合ドキュメントを參照してください
wandb ログイン キーを生成する手順は下記です。
- wandb アカウントを作成し、ログイン
- ユーザー設定を開き、API Key をコピー
Weights & Biases の API キーを環境変數として書き込みます。
# set docker env variable.
import json
import os
mounts_file = os.path.expanduser("~/.tao_mounts.json")
tlt_configs["Envs"]= [
        {
            "variable": "WANDB_API_KEY",
            "value": os.environ["WANDB_API_KEY"]
        }
    ]
# Writing the mounts file.
with open(mounts_file, "w") as mfile:
    json.dump(tlt_configs, mfile, indent=4)
下記のように tao_mounts.json に書き込まれていることが確認できます。
!cat ~/.tao_mounts.json{
"Mounts": [
{
"source": "{local project path}",
"destination": "{container path}"
},
{
"source": "{local data path}",
"destination": "{container data path}"
},
{
"source": "{local spec path}",
"destination": "{container spec path}"
},
{
"source": "{local result path}",
"destination": "{container result path}"
}
],
"DockerOptions": {
"shm_size": "16G",
"ulimits": {
"memlock": -1,
"stack": 67108864
},
"network": "host"
}
"Envs": [
{
"variable": "WANDB_API_KEY",
"value": "{ your WANDB API KEY }"
}
]
}アノテーション ファイルが分析され、wandb.visualize=True を設定することで、wandb 上に洞察グラフが生成されます。生成されたグラフは、wandb.project パラメーターで指定されたプロジェクト名の下にある wandb で見つけることができます。
!tao dataset analytics analyze -e $SPECS_DIR/analytics.yaml wandb.visualize=True下記のように Weights & Biases のリンクが出力されるので、リンクにアクセスすると確認できます。
Log file already exists at /results/analytics/status.json
Starting Data-services KITTI analysis.
wandb: Currently logged in as: {your User Name}. Use `wandb login --relogin` to force relogin
wandb: Appending key for api.wandb.ai to your netrc file: /root/.netrc
Initializing wandb.
wandb: wandb version 0.15.7 is available!  To upgrade, please run:
wandb:  $ pip install wandb --upgrade
wandb: Tracking run with wandb version 0.13.10
wandb: Run data is saved locally in /results/analytics/wandb/run-20230801_023158-kxxzqw1v
wandb: Run `wandb offline` to turn off syncing.
wandb: Syncing run run_01/23/08_02:31:58
wandb: ?? View project at {your wandb address}
wandb: ?? View run at https://wandb.ai/{your wandb address}
Kitti analysis finished successfully.
wandb: Waiting for W&B process to finish... (success).
wandb: ?? View run run_01/23/08_02:31:58 at: https://wandb.ai/{your wandb address}
wandb: Synced 5 W&B file(s), 13 media file(s), 13 artifact file(s) and 0 other file(s)
wandb: Find logs at: /results/analytics/wandb/run-20230801_023158-kxxzqw1v/logs
Sending telemetry data.
Execution status: PASS
Weights & Biases で下記のような畫面を確認できます。
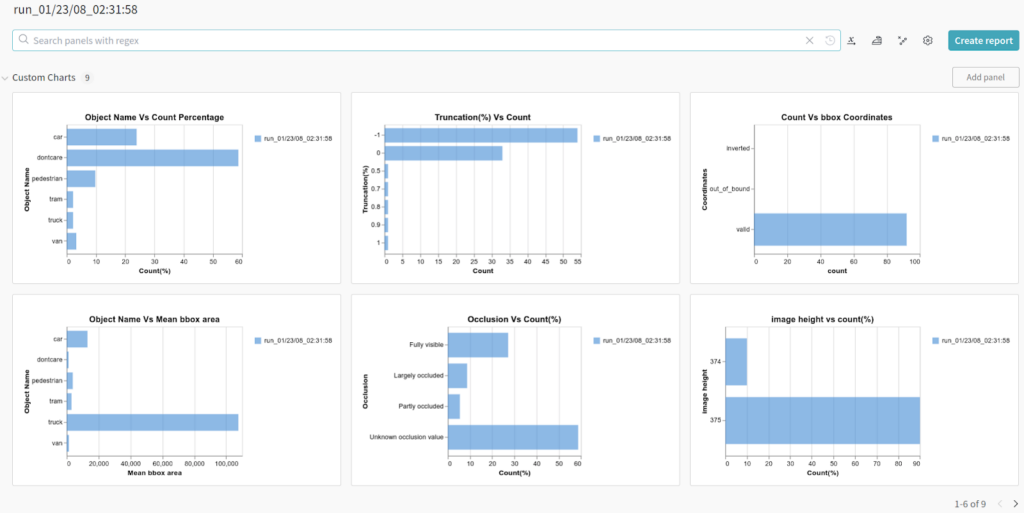
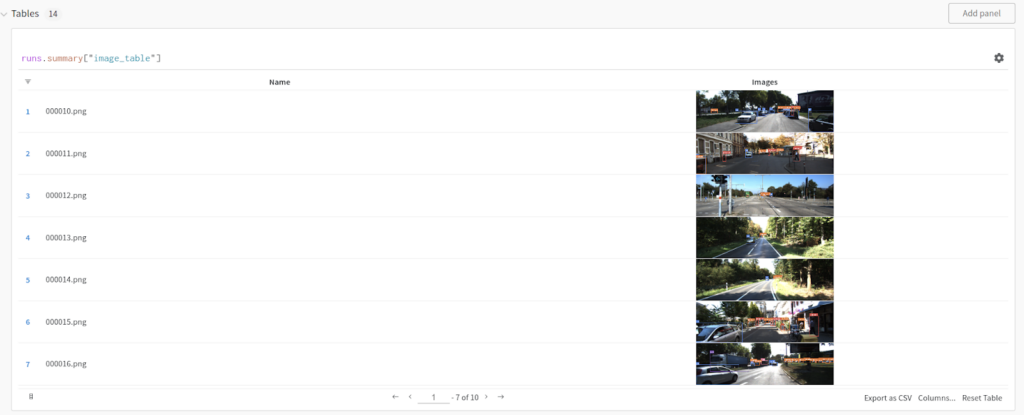
image.generate_image_with_bounding_box=True と wandb.visualize=True を設定することで、wandb にグラフとバウンディング ボックス付きのアノテーション畫像を生成します。
!tao dataset analytics analyze -e $SPECS_DIR/analytics.yaml wandb.visualize=True image.generate_image_with_bounding_box=TrueWeights & Biases のリンクが出力されるので同様にアクセスすると下記のようなブラウザー畫面が確認できます。
データ検証仕様を提供
データ検証パラメーターを設定するための仕様ファイルを提供します。
- apply_correction: True
- data:
- output_dir: “/results/analytics”
- input_format: “KITTI”
- image_dir: “/data/images”
- ann_path: “/data/labels”
- workers: 2
apply_correction パラメーターは、アノテーション ファイル內の無効なバウンディング ボックス座標を修正するかどうかを決定します。修正されたファイルは data.output_dir に保存されます。
!cat $HOST_SPECS_DIR/validate.yamlapply_correction: True
data:
output_dir: "/results/analytics"
input_format: "KITTI"
image_dir: "/data/images"
ann_path: "/data/labels"
workers: 2データ検証タスクは、反転したバウンディング ボックスや境界から外れたバウンディング ボックスの座標の數を計算し、ユーザーが與えられたデータで學習を進めるべきか、修正を適用すべきかを提案します。検証サマリーは、データが不均衡であるかどうかを確認するために、オブジェクト タグのカウントも表示します。無効な座標は、apply_correction = True を指定することで修正できます。補正後のファイルは data.output_dir に保存されます。以下は、バウンディング ボックス座標の補正條件です。
- 負の座標を 0 にする
- 反転した座標を入れ替える
- xmax が image_width より大きい場合は、xmax = image_width とする
- ymaxが image_height より大きい場合は、ymax = image_height とする
下記の実行結果は反転座標や境界外の座標がないため、無効な座標の數は 0 となります。
!tao dataset analytics validate -e $SPECS_DIR/validate.yamlStarting Data-services KITTI validation.
Number of total annotations : 92
Number of invalid annotations : 0
Number of invalid annotations are 0.0 of total annotations,
Number and Percent of annotations with out of bound coordinates 0, 0.0%
Number and Percent of annotations with inverted coordinates 0, 0.0%
Review below table to find if data for object tags is imbalanced
Object_tags Percentage
0 dontcare 58.695652
1 car 23.913043
2 pedestrian 9.782609
3 van 3.260870
4 truck 2.173913
5 tram 2.173913
Total kitti files to be corrected - 0
Corrected kitti files are available at /results/analytics/corrected_kitti_files
Kitti validation finished successfully.
Sending telemetry data.
Execution status: PASSまとめ
本記事では TAO Toolkit 5.0 で追加された TAO Data Service について紹介しました。この機能によってデータ拡張、データ アノテーション、データ分析が効率化できれば幸いです。